
September 2026 Newsletter
VEGA Asset Management’s September 2026 newsletter reviews the factors shaping international and South African markets, including interest rates, inflation, currency movements and geopolitical pressure. It also provides an update on the VEGA Global Strategic Fund, examines McDonald’s as the share of the month, and considers Morgan Housel’s lessons on balancing optimism with preparedness.
Categories:
Date Posted:
September 16, 2026
Highlights of this month’s newsletter:
“If the rules are such that you can’t make progress, then you have to fight the rules.”
― Elon Musk
Market overview: performance figures (%)
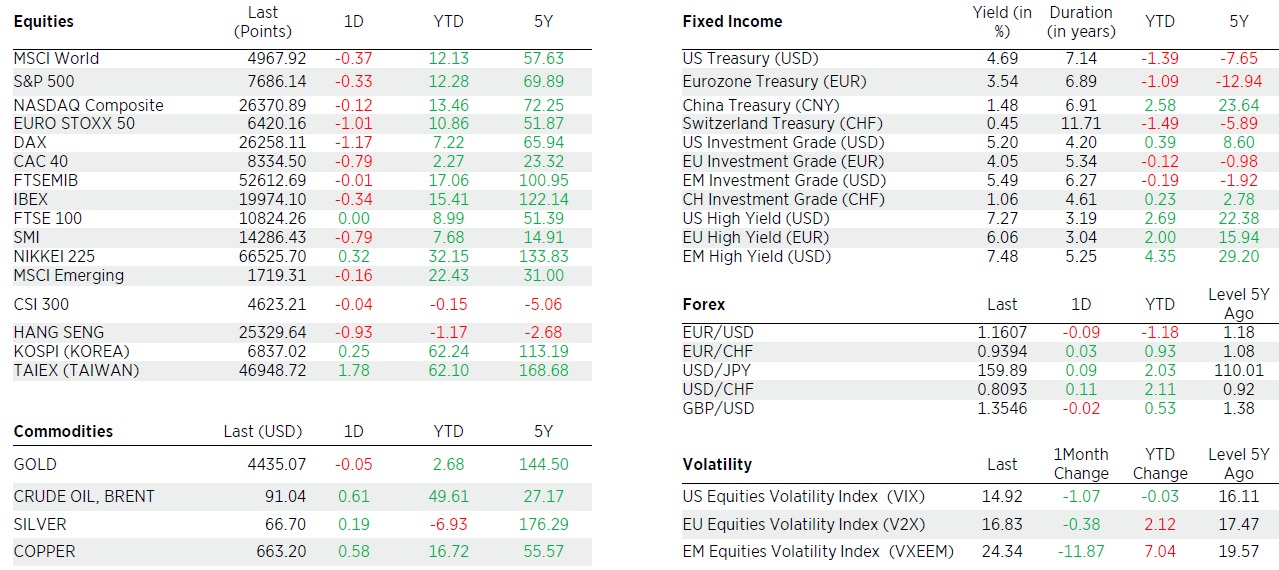
Source: Edmond de Rothschild, 31.08.2026
International market overview
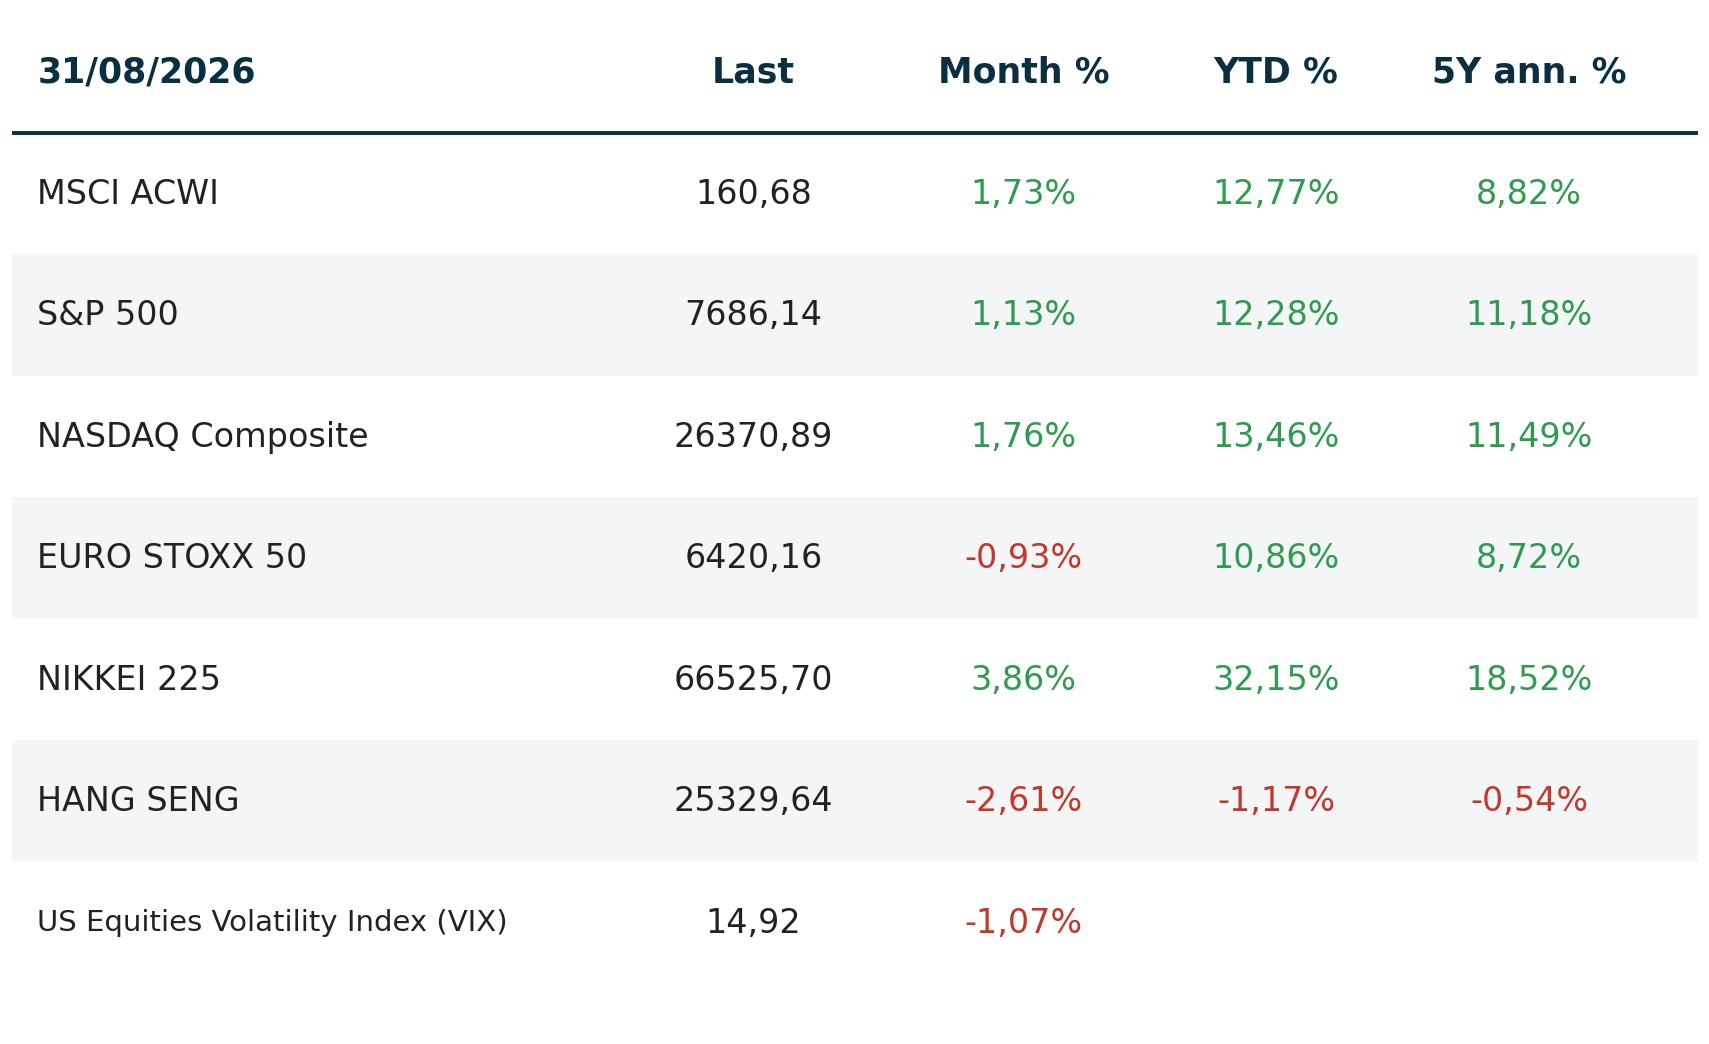
Source: Edmond de Rothschild
International markets faced heightened volatility in August as multiple shocks collided: Fed Chair Warsh’s hawkish Jackson Hole pivot, escalating Iran sanctions and Hormuz risk, and record US debt pushing 30-year yields to 2007 highs. Investors are also questioning whether AI capital expenditure is sustainable amid deteriorating hyperscaler free cash flows.
Jackson Hole
Kevin Warsh came across as more hawkish than expected at Jackson Hole, reiterating the need to act quickly if disinflation stalls. He pledged to return inflation to the 2% target and signaled that rates could rise further, strengthening the dollar and reversing part of the debasement trade that had lifted gold roughly 14% in August. The hawkish shift also weighed on growth assets: higher rates lift borrowing costs and raise the discount rate applied to future cash flows, lowering their present value.
The main risks for equity markets:
- US debt levels, US fiscal deficit and US Treasury yields
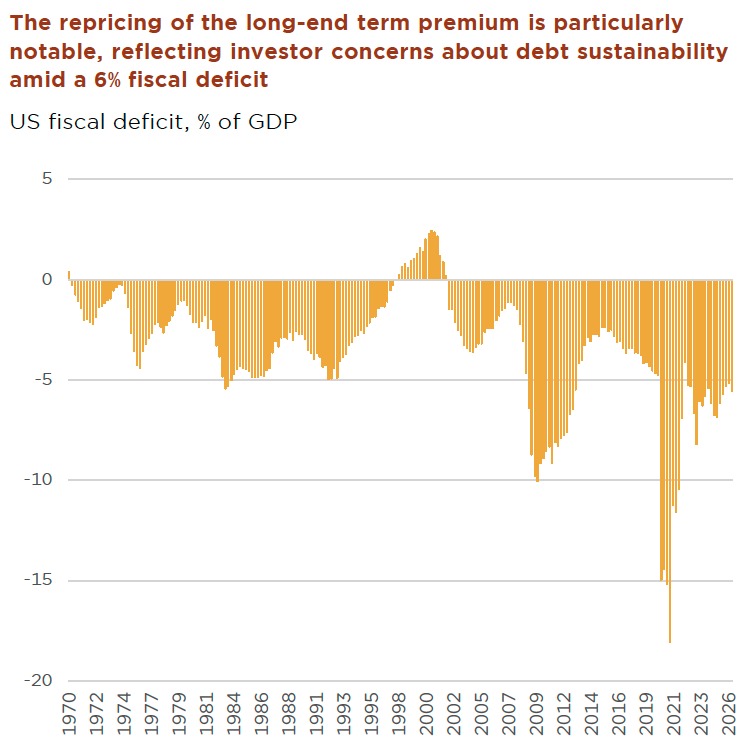
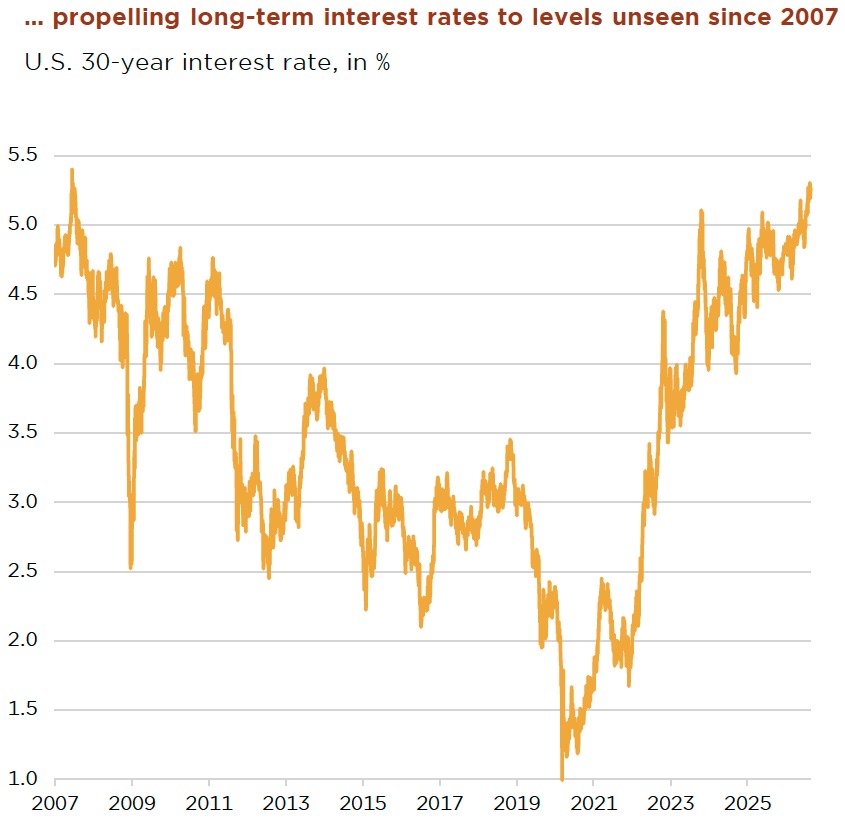
US 30-year Treasury yields surpassed 5.3% in August, a 19-year high, as US national debt reached a record $40 trillion. In response, the Treasury announced it would at least double the maximum size of its longer-dated buyback operations to $4 billion per operation. The 30-year yield fell 9 basis points on the announcement, but the relief proved short-lived: yields reversed the following day, climbing back to around 5.25%, essentially where they stood beforehand. The market did not read the move as a lasting solution. These are liquidity-support operations that leave the fundamentals unchanged: the deficit remains wide and must still be financed through further issuance. The repricing of term premium at the long end is particularly notable, reflecting investor concern about debt sustainability amid a fiscal deficit near 6% of GDP.
Graph 1: US fiscal deficit, % of GDP
Source: Edmond de Rothschild
Graph 2: US 30-year yield, in %
Source: Edmond de Rothschild
NVIDIA Corp.
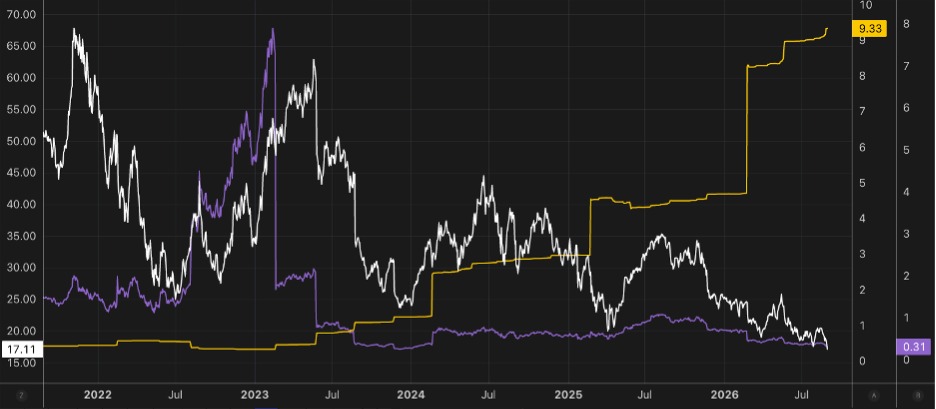
Nvidia reported fiscal second-quarter revenue of $96 billion, up 106% year over year and ahead of guidance of $91 billion. The company expects October-quarter revenue of $108 billion, up 89% year over year and ahead of FactSet consensus of $105 billion. The standout, in our view, was Nvidia’s remarkable forecast of 70% revenue growth next year (fiscal 2028), implying close to $700 billion in total revenue against our prior estimates and FactSet consensus of around $570 billion. Nvidia noted this growth rate is supply-constrained, meaning the forecast could prove conservative if suppliers expand capacity faster than anticipated. The only blemish was Nvidia’s gross margin reset, with guidance for a decline from 75% in the July quarter to 74% in October, 71.5% in January, and 72.5% for fiscal 2028, driven by sharply higher memory prices.
Nvidia forecast that its top five US hyperscaler customers will spend $1.3 trillion on AI capital expenditure next year, versus what we believe the market was estimating at $1.0 trillion, or less. We are struck that AI demand has yet to peak and is instead accelerating. Token usage continues to rise exponentially, and elevated GPU rental prices suggest the market for AI accelerators remains supply-constrained for AI labs. Nvidia remains one of our top picks. The shares trade at a forward price-to-earnings multiple of around 17, among the cheapest levels in the history of the company.
Graph 3: Valuation of Nvidia – Forward price to earnings (white line); Earnings estimate (yellow line); Price to earnings/growth (purple line)
Source: LSEG
Japanese bond yields and the Yen
Japan’s Ministry of Finance (MoF) intervened in foreign exchange markets to support the yen for the second time this year, spending an estimated JPY 8tn ($54bn) on 30 July and JPY 5tn ($34bn) on 31 July. The US joined the intervention on the 31st of July, supporting the yen through sales of its euro reserves, an action that has historically accompanied only severe crises.
The key driver of recent yen weakness remains the Bank of Japan falling behind the inflation curve. Conditions for more substantial tightening are building, but markets need firmer signals from policymakers before that view is validated. US Treasury Secretary Bessent, for his part, expects the interventions to be followed through with policy action from Tokyo. The most probable rationale for US participation is the risk that Japan begins selling US Treasuries to fund yen repurchases in defense of its currency, pressure that would fall on US yields that are already uncomfortably high.
Iran Tensions Escalate – more inflation pressure
Struggling to contain Iran militarily, the US shifted toward economic pressure, with Treasury Secretary Scott Bessent signaling unprecedented sanctions aimed primarily at China and India, Iran’s largest oil buyers, to cut off Tehran’s funding. The move itself risked pushing oil prices higher, given Iran’s threats against sanctions-compliant countries and shipping through the Strait of Hormuz. That preference for economic pressure gave way to military escalation on Sunday 30 August, when US forces struck two Iranian rocket launchers on Larak Island after the Revolutionary Guards were reportedly preparing to fire rockets carrying sea mines into the strait. Iran retaliated the following day with a missile and drone attack on US air bases in Jordan, sending Brent crude back above $90 per barrel. A key driver of elevated US yields is inflation expectations, and the escalation feeds directly into that channel: higher oil prices lift expected inflation, which raises the inflation premium embedded in nominal yields. In our view, it also adds to the pressure on the Fed to keep policy tighter for longer.
Hyperscalers issuing debt
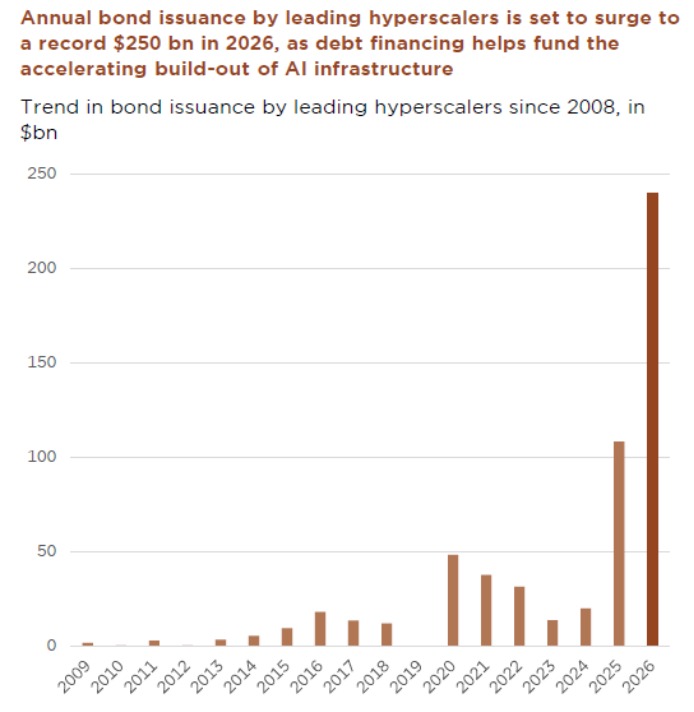
Hyperscalers are also issuing increasingly large volumes of debt to finance the AI buildout. Global bond yields are already elevated, meaning bond prices have fallen, and a wave of fresh hyperscaler issuance adds further supply against broadly unchanged demand, which pushes yields higher still. This has a cost: to place that debt, issuers must offer more attractive terms, and the resulting rise in interest expense weighs on margins. The scale is significant, AI capital expenditure is expected to exceed $1 trillion in 2027, up from around $410bn in 2025. The offsetting positive is that the cloud franchises funding this spend continue to post strong revenue growth and robust operating cash flow, and the buildout is supporting nominal demand across the economy.
Graph 4: Trend in bond issuances by leading hyperscalers since 2008, in $bn
Source: Edmond de Rothschild
Gold impressed in August
For many of the reasons outlined above, investors moved to increase gold and gold-miner exposure. The investment case for gold has strengthened on the back of elevated global debt levels and the view that some major central banks are behind the curve on inflation. Gold performs well if central banks—most importantly the Fed—prove too dovish and inflation runs away from them. The reverse also holds: were the Fed to raise rates aggressively and real yields to move higher, the opportunity cost of holding gold would rise, prompting rotation out of gold and into bonds.
Summary
We remain bullish on equities, which have delivered positive returns across different rate regimes, through both rising and falling yields. The key distinction is what is driving rates. When inflation is the market’s focus, equities and yields tend to be negatively correlated; when growth is the focus, that correlation typically turns positive. Inflation is currently the dominant focus, which on its own is not an obviously favorable backdrop for equities. Offsetting this, however, is broadly solid revenue growth and resilient margins at the aggregate level.
This read on rates also shapes our hedging. The recent rise in yields is not a growth story but a repricing of fiscal and inflation risk, a signal the dollar and gold are both reflecting. Against that backdrop we remain bullish on gold miners, which offer a useful inflation hedge should the Fed prove too accommodative and inflation stay sticky. Even after Warsh’s more hawkish-than-expected tone, our view is that political pressure from President Trump keeps policy looser than the rhetoric implies. Alongside this, we have maintained our position in oil refiners, which hedges both inflation and Middle East political risk. Together, the gold and oil exposures have also helped reduce portfolio volatility.
South African market overview
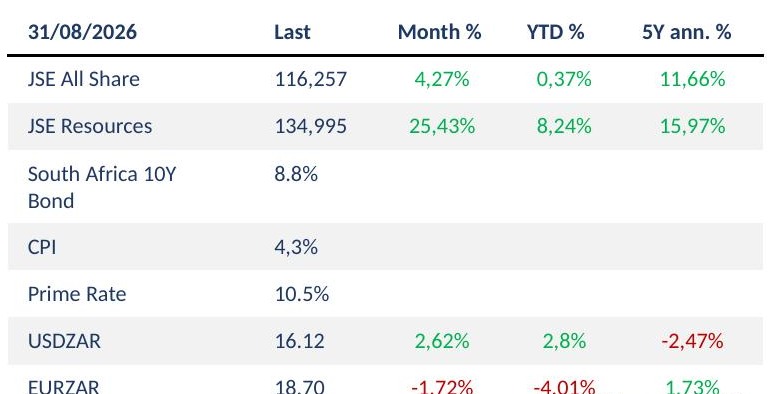
Source: Moneyweb, SARB
Strengthening of the rand
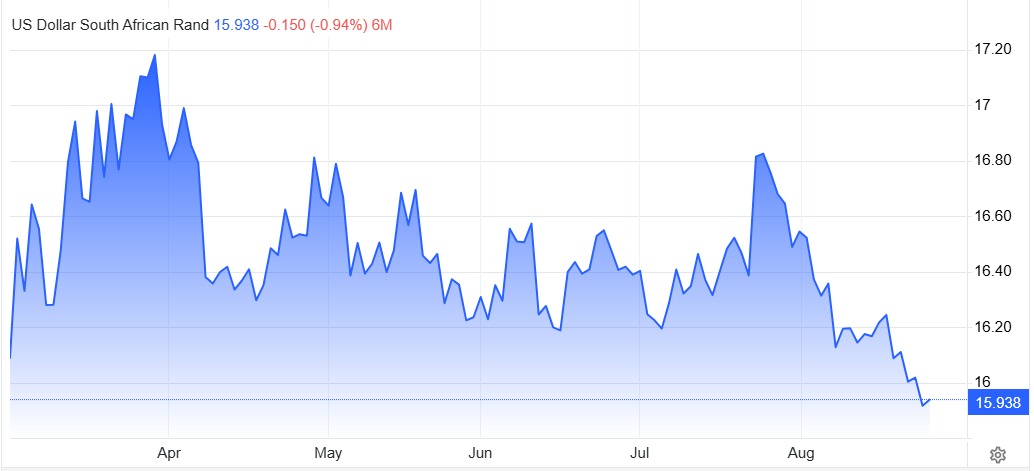
The rand has strengthened to around R15.90/US$1 on 26 August from R16.20 earlier in the month and R16.40 at the end of July, trading below 16 per dollar for the first time since late February. A softer US dollar, elevated gold and platinum prices and stronger appetite for emerging-market assets have supported the currency, helped by lower oil prices and fading concerns over expanded US sanctions on Iran. Improved terms of trade, the SARB’s restrictive stance, confidence in structural reforms and a better fiscal outlook remain supportive, although the recovery in Brent crude is a renewed risk given SA’s reliance on imported fuel.
Graph 6: Rand vs US Dollar (6 Months)
Source: Trading Economics
Inflation slowed in July, but the relief looks temporary
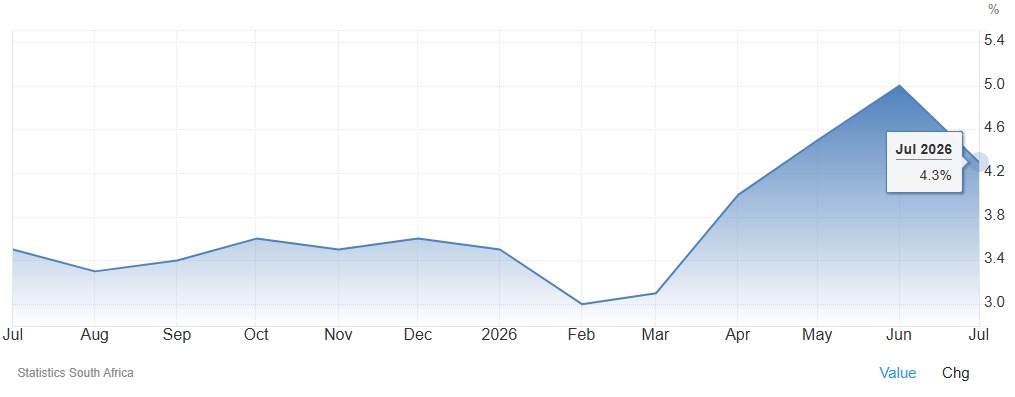
Headline inflation slowed to 4.3% YoY in July from 5.0% in June, below the 4.5% expected, while core edged up to 4.2% from 4.1%. On a monthly basis headline moderated to 0.2% from 0.7% and core to 0.5% from 0.7%. The move was largely base effects and cheaper fuel, with petrol 95 down about 7% and diesel down about 11% in July. That relief is already fading: diesel rose a further 6% in August and the Central Energy Fund points to September increases of roughly R2.90/litre for diesel and 88c/litre for petrol. Food inflation stayed subdued at 0.9% YoY from 1.6%, against a 0.6% rise in the FAO Food Price Index to 131.1 points, with favourable base effects, better agricultural conditions and ample supply cushioning local consumers.
Graph 7: South African Inflation Rate
Source: Trading Economics
Unemployment rises to 33.6% as job creation stalls
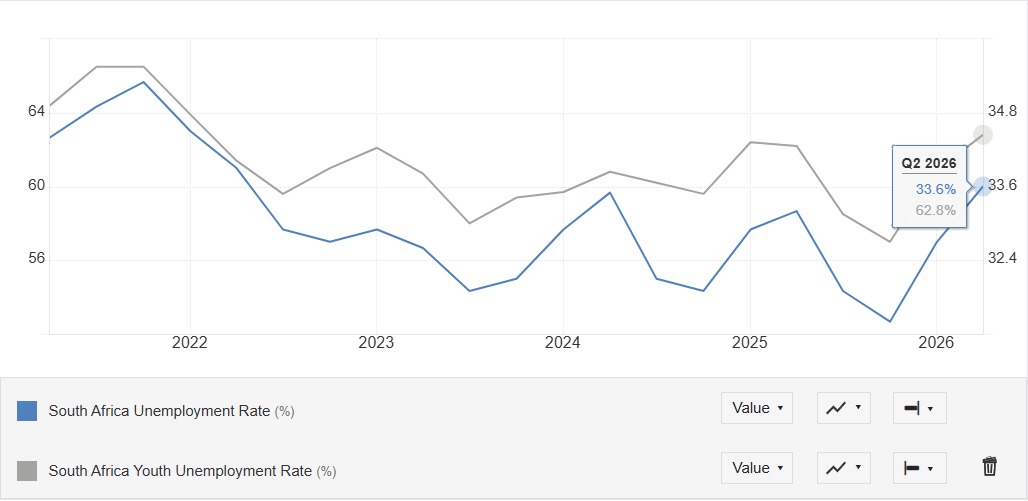
The labour market weakened in 2Q26, with the official unemployment rate up 0.9pp to 33.6% from 32.7%. The number of unemployed rose 345,000 to 8.5mn while employment fell 16,000 to 16.7mn and the labour force expanded by 329,000. The increase reflects the economy’s inability to absorb new entrants rather than widespread job losses: growth has struggled to hold above 2%, with infrastructure constraints, weak private investment and political uncertainty weighing on capacity. Youth unemployment climbed to 47.4%, with 264,000 more unemployed aged 15 to 34 taking the total to 5mn, an issue likely to feature in the local government elections.
Graph 8: South African Unemployment Rate
Source: Trading Economics
Repo rate unchanged, but a hike is still on the table
The SARB’s Monetary Policy Committee left the repo rate at 7.00% in July. The moderation in headline inflation is encouraging, but at 4.3% it remains above the 3% target and the 4% upper tolerance limit, and Brent above US$90/bbl versus around US$70/bbl in early July keeps the energy risk live. We expect a relatively restrictive stance to persist, with one further 25bp increase likely in 2H26. The high policy rate also preserves an attractive carry advantage over developed-market currencies, supporting demand for local assets.
Don’t fear El Niño for SA
Fears that El Niño will damage local agriculture look overdone. SA farmers enter the 2026/27 season better geared than in 2015/16: soil moisture is materially higher and dams are full after good rains, while a robust season of record grain and oilseed harvests provides a base for the next. Should conditions match the extremes seen in parts of Europe and the Americas, that cushion may not last, and farmers will need to manage water and input resources more carefully.
PGM boom fuels record profits and a takeover battle
Northam’s FY2026 was a record: HEPS R30.44 (~8x), revenue +64% to R54bn, operating profit +294% to R14.2bn, on a 57% higher PGM basket price. FY2026 dividends totalled R17/share. Valterra’s H1 2026 was similarly strong (revenue +93%, EBITDA +406%). Northam confirmed an unsolicited approach from a major SA PGM producer and launched a review, no suitor named, no commitment, so consolidation remains speculative.
VEGA Global Strategic Fund Update
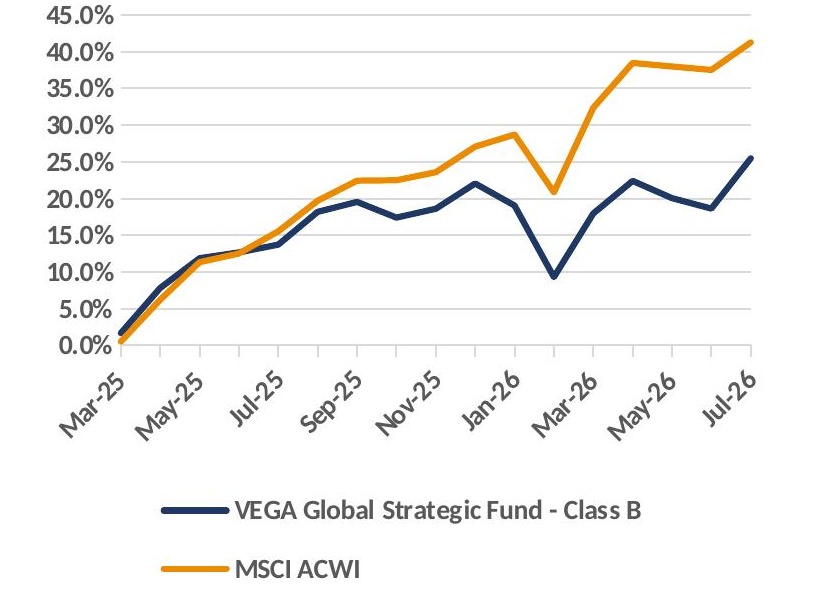
August was a strong month, with the VEGA Global Strategic Fund gaining 5.77% over the month while the MSCI All Country World Index, our reference benchmark, rose 2.72% in USD terms. The fund is now 5.80% higher year to date, against the benchmark’s 14.30%. We remain confident that the quality businesses we hold will continue to compound as conditions normalise.
Graph 9: Total return in USD since inception
Changes during the Month:
Added Position – McDonald’s (MCD).
We added McDonald’s for defensive, dollar-based cash flow that is largely insulated from the AI capital cycle and macro volatility weighing on growth names. Its franchised, asset-light model generates high returns on capital and consistent free cash flow, while global menu and value initiatives support steady same-store sales. The dividend and buyback programme remain well funded, offering ballast to the portfolio during periods of heightened uncertainty.
Top Holding – NVIDIA (NVDA).
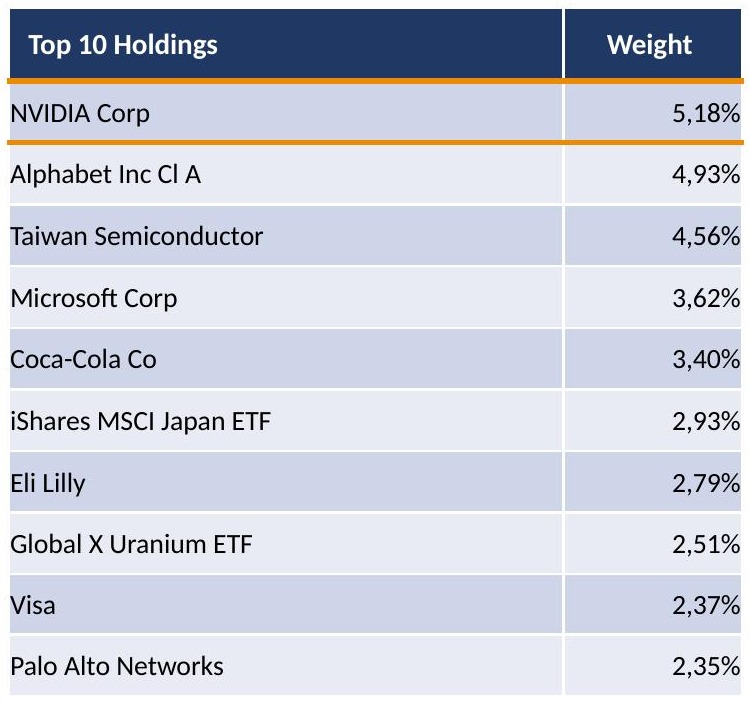
NVIDIA is our largest position at 5.18% of the fund, underpinned by its dominant position in AI accelerators and the software ecosystem built around them. Demand for compute continues to outstrip supply as hyperscalers and enterprises scale out AI infrastructure, and the company’s pricing power and margins have remained resilient through successive product cycles.
Top Holding – Alphabet (GOOGL). A
lphabet is our second-largest holding at 4.93%, combining a dominant, highly cash-generative search and advertising franchise with a fast-growing cloud business and leading position in AI research. Gemini’s momentum and tight integration across Search, Cloud and YouTube give the group multiple avenues to monetise AI, while the core business continues to fund substantial buybacks.
Portfolio strategy
In the wake of heightened market volatility following President Trump’s tariff announcements, our stance has been to remain disciplined and avoid reactive portfolio shifts. History consistently shows that impulsive responses to short-term political noise often result in suboptimal investment outcomes.
Instead, we have used this environment to evaluate high-quality businesses that were indiscriminately sold off despite their strong long-term fundamentals. Periods of uncertainty can create attractive entry points into quality companies at compelling valuations, and we continue to focus on identifying these opportunities with a long-term perspective.
The portfolio remains invested in leading global businesses with durable competitive advantages, particularly those delivering high returns on capital and robust free cash flow generation. Dividend policies are not a central consideration in our selection process, as we generally favor companies that reinvest earnings to drive future growth.
We also resist the temptation to follow short-lived market trends or fashionable investment narratives, as preserving portfolio quality takes precedence over chasing momentum.
Top 10 Holdings
Monthly returns in USD net of fees

Share of the month: Mcdonald’s (MCD)
Investment Case | Wide Moat | Exemplary Capital Allocation | Fair Value: $295/share

Business Strategy & Outlook
McDonald’s is the world’s largest restaurant brand, with over 45,000 locations across more than 100 countries and roughly $139 billion in systemwide sales. The Golden Arches sit at the pinnacle of restaurant brand recognition, and management estimates that 80% of the population in the group’s largest markets visits at least once a year.
The firm is sharpening its value proposition after roughly 40% cumulative price increases since 2019, leaning into lower nationally advertised price points, expanded combo deals, and menu innovation around chicken and beverages. Second-quarter FY26 delivered 4.3% global unit growth and 1.3% comparable sales, though US comps of 0.8% trailed, prompting management to restore loyalty engagement and re-engage franchisees.
Longer term, systemwide sales growth is forecast at 6% over the next decade, driven by 3.7% unit growth and 3.5% comparable sales, comfortably ahead of the 4.5% industry rate. Growth is anchored by international developmental markets (8.9% forecast system sales growth), an expanding loyalty base targeting 250 million members by 2027, and continued technology investment.
Economic Moat
McDonald’s is assigned a wide economic moat based on intangible assets and a cost advantage. The firm’s 4.2% share of global foodservice is more than twice that of Yum Brands and roughly triple Restaurant Brands, both multibrand operators. Returns on invested capital have averaged 22% over the past decade against a 7% cost of capital.
- Brand equity: The Golden Arches command global recognition across 45,000 locations, supporting comp growth of 5.4% over the past seven years versus 2.2% for the industry.
- Pricing power: 17 individual billion-dollar menu items (65% of sales) enable price increases without eroding perceived value, evidenced by 5.2% annual comp growth since 2020.
- Unit economics: US average unit volumes of ~$4 million dwarf peers (Wendy’s $2m, Burger King $1.6m), delivering roughly 20% franchisee cash-on-cash returns.
- Procurement scale: Over $50 billion in annual purchases drives volume discounts, favorable supplier pricing, and lower last-mile delivery costs per store.
- Marketing and technology: A $2.2 billion US ad fund plus 46 million US 90-day active loyalty members enable targeting, and traffic-driving campaigns at unmatched scale.
Financial Strength
McDonald’s balance sheet is solid, with roughly $40 billion of debt at end-2025 (2.7x EBITDA) and interest coverage projected at around 10x EBITDA over the next five years. A 95% franchised estate, with over 60% of revenue derived from recurring royalties and occupancy, underpins resilient cash flows through the cycle.
Average free cash flow margins are forecast at approximately 33%, with capital expenditure of $20 billion (12.7% of revenue) over the next five years, funding unit expansion, remodels, and technology upgrades.
Consolidated operating margin is projected to expand from 46.1% in 2025 to 52% by 2035, supported by the growing mix of franchise revenue (rising to 66% from 62%) and improving restaurant margins (14.7% to 19.1%).
Capital Allocation
McDonald’s is assigned an Exemplary Capital Allocation rating, recently upgraded from Standard on growing conviction in the firm’s investment discipline and strategy under CEO Chris Kempczinski, who took the helm in late 2019.
The Accelerating the Arches initiative has centralised systems, data, and technology across markets, strengthening brand consistency, franchisee oversight, and supply chain efficiency. The 2015 decision to refranchise to roughly 95% traded volatile unit-level profitability for steadier royalty income.
Shareholder returns are generous and consistent, with average annual dividend growth of 9% projected over the next decade against a 59% payout ratio, and a $15 billion buyback authorisation supporting opportunistic repurchases when shares trade below fair value.
Key Risks
- Consumer and macro pressure: McDonald’s over-indexes with lower-income diners exposed to traffic pressure after steep price hikes; US comps have already slipped negative.
- Franchisee constraints: Pricing sits largely with local franchisees, complicating value-lineup shifts, while rising beef and wage costs could pressure their cash flows.
- International competition: Scaled global rivals are expanding aggressively abroad, risking comp or unit growth compression in markets anchoring the growth story.
- Health and regulatory shifts: Rising GLP-1 use and scrutiny of ultra-processed foods may steer traffic away from traditional fast-food over time.
Source: Morningstar
Same as Ever – Chapter 13: Elation and Despair
Morgan Housel opens Chapter 13 with a paradox at the heart of every successful investor: optimism and pessimism aren’t opposites to choose between, but partners that must be held together. We assume a person is either a hopeful believer or a hardened realist. Housel argues this is a false choice. Genuine progress, in a portfolio, a business, or a nation, depends on preparing seriously for hardship while remaining convinced things will ultimately improve.
His most powerful illustration is Admiral Jim Stockdale, the highest-ranking American officer held prisoner during the Vietnam War. Stockdale endured years of captivity and torture, yet never lost his conviction that he would eventually be freed. Strikingly, it was not the realists who failed to survive, but the pure optimists, the men who told themselves they’d be home by Christmas. When Christmas came and went, their unfounded hope curdled into despair. Lesson: retain absolute faith that you will prevail, without ever denying the brutal facts in front of you.
The same duality appears in “the American Dream,” a phrase James Truslow Adams coined not during prosperity, but in the depths of the Great Depression. At the moment optimism seemed least warranted, the idea of a better future took hold and flourished. Hope can thrive precisely when circumstances contradict it. Belief in eventual betterment isn’t naive wishful thinking, but a psychological anchor that lets people keep building through periods that might otherwise overwhelm them.
The Psychology Behind It
Pessimism carries an intellectual allure that optimism does not. A warning of disaster sounds thoughtful, while a forecast of steady improvement can sound complacent. Pessimism also demands immediate attention, because a threat feels urgent in a way slow progress never does. We’re drawn to the voice predicting collapse and inclined to dismiss the one quietly noting how much better things have become.
Psychologists describe depressive realism: the idea that people in low moods sometimes see life’s fragility more clearly than cheerful optimists do. Blissful ignorance may bring short-term contentment, but it can disconnect a person from reality in costly ways. A clear-eyed appreciation of how easily things can go wrong isn’t a weakness; in the right measure, it’s exactly what motivates the caution that makes lasting progress possible.
Housel’s resolution is to see optimism and pessimism not as a binary choice but as points on a spectrum. The most useful position is the rational optimist: someone who fully accepts that setbacks are inevitable, yet remains confident the long-term direction is upward. This isn’t a contradiction—it’s recognizing that the road to any worthwhile destination runs through difficulty, and enduring it is the price of arriving at all.
What This Means for Investors
For investors, Housel distils this into one of finance’s most useful principles: save like a pessimist and invest like an optimist. Saving reflects a sober acknowledgement that shocks will arrive without warning, so you must keep enough in reserve to withstand them. Investing reflects a deep faith that, over time, human ingenuity and compounding will reward patience. Bill Gates embodied this balance: confident enough in technology to build something extraordinary, yet he insisted on holding enough cash to keep Microsoft running for a full year without revenue.
For private clients, the practical lesson is to build a strategy that absorbs bad news without being derailed by it: save and diversify as though difficult periods are certain, because they are, while staying invested as though the long-term future remains bright, because history suggests it does. This also means letting go of the perfectionism that undermines good decisions. A portfolio doesn’t need to be flawless—it needs to be durable enough to endure the bad days so it’s still standing to enjoy the good ones.
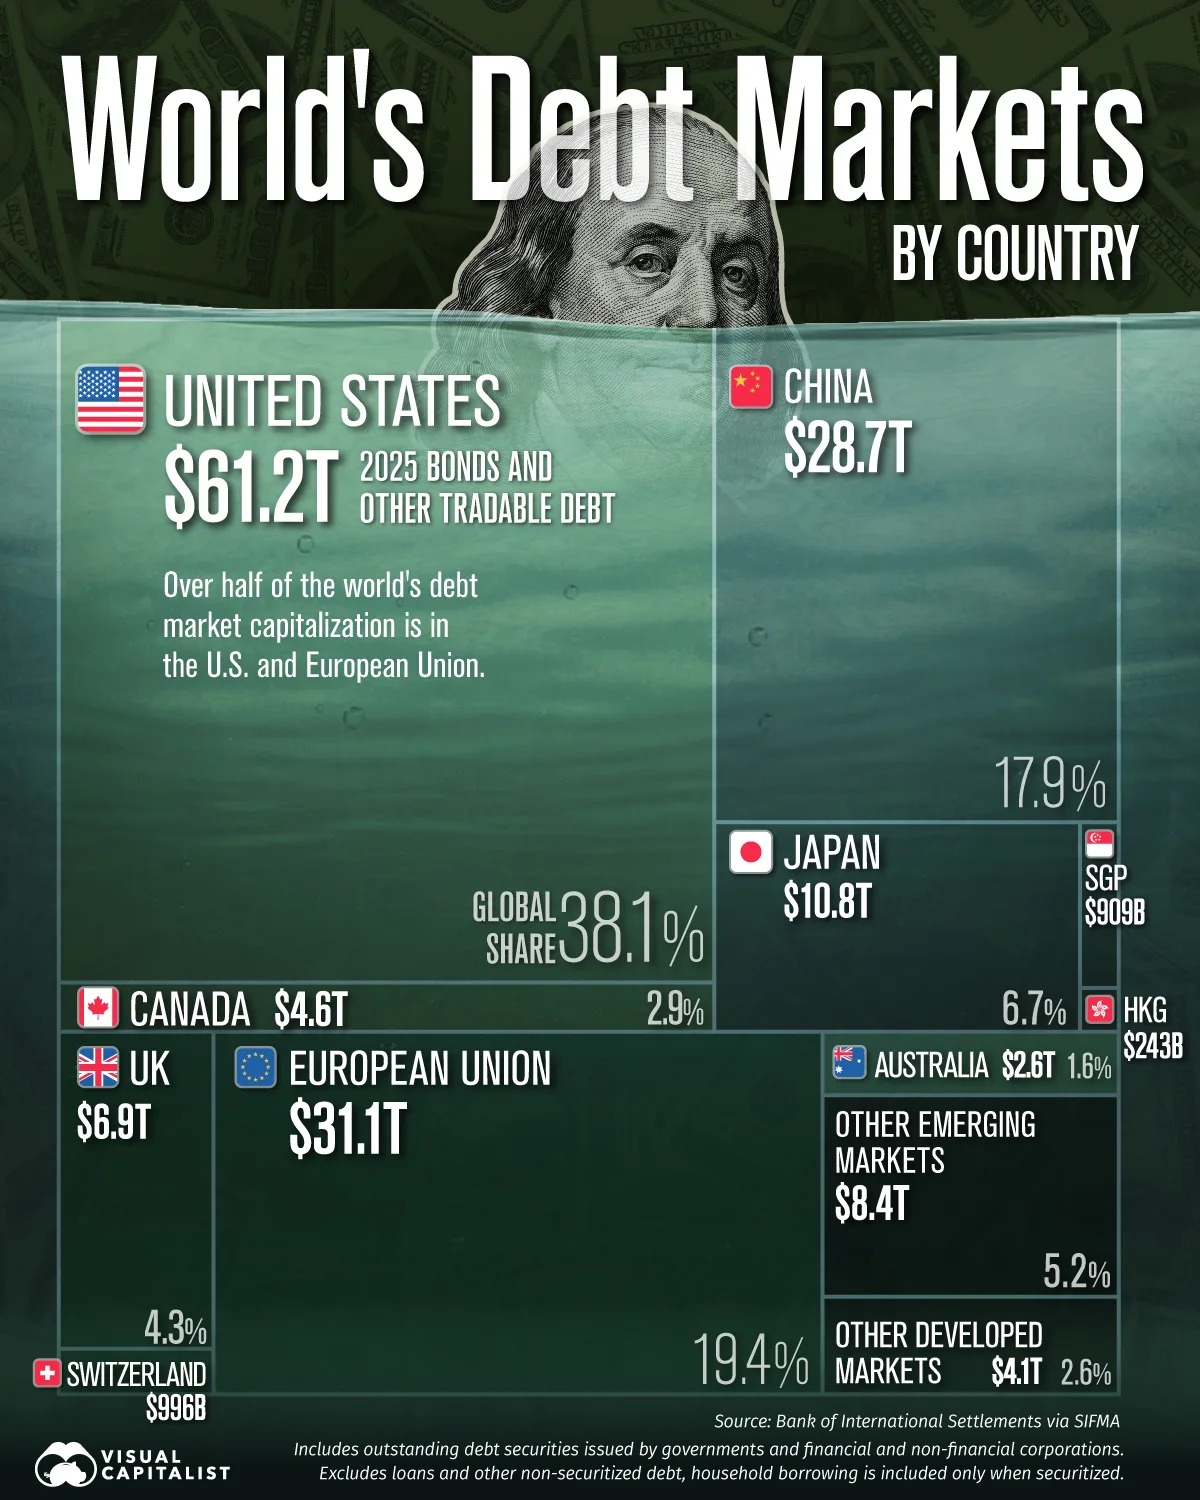
Graph of the month
Source: Visual Capitalist
Sources
Alpine Macro, Anchor, Barchart, Bloomberg, BNY Mellon, Business Day, BusinessTech, Central Energy Fund, Charlie Bilello, Citi, CNBC, Compound Advisors, DigitFMS, Edmond De Rothschild, ETFMG, EWN, FactSet, Finimize, FXStreet, Haver Analytics, Investing.com, InvestorIdeas, IOL, JP Morgan, Julius Baer, LSEG, Moneyweb, Morgan Stanley, Morningstar, News24, Refinitiv, Reuters, RMB, SAnews, SARB, Société Générale, Statista, Statistics South Africa, Strategas, Sygnia, The Intelligent Investor, The South African, TimesLIVE, Trading Economics, TreasuryONE, UBS, Vutivi Business, Wise.
Disclaimer
VEGA Asset Management has taken care that all information provided in this document is true and correct. VEGA Asset Management does not accept responsibility for any claim, liability, loss, expense, or damage. Any information herein is not intended nor does it constitute financial, tax, legal, investment, or other advice. VEGA Asset Management is an authorised Financial Service Provider with FSP number 776. Past performance is not necessarily an indication of future performance.