May 2026 Newsletter
Markets rebounded sharply in April as earnings season delivered stronger-than-expected results from global leaders such as Alphabet, Microsoft, Amazon, and Coca-Cola. In this edition, we unpack the latest international and South African market developments, review changes to the VEGA Global Strategic Fund, and explore Amazon as our Share of the Month. We also reflect on Morgan Housel’s Same as Ever, Chapter 9, and the dangers of pursuing growth too much, too soon, too fast.
Categories:
Date Posted:
May 6, 2026
Highlights of this month’s newsletter:
“Freedom is just another word for nothin’ left to lose . . .”
― Me and Bobby McGee by Janis Joplin
Market overview: performance figures (%)
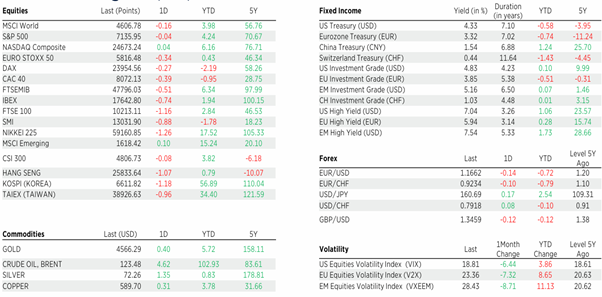
Source: Edmond de Rothschild, 30.04.2026
International market overview

Source: Edmond de Rothschild
Markets rallied during the month on hopes that the iranian conflict would draw to a close. However, volatility remains elevated, as significant uncertainty persists around the war’s trajectory, with neither side showing meaningful signs of standing down. April also marked the start of earnings season, and the results were decidedly mixed: some companies delivered exceptional results, while others fell short of expectations. We review the most notable earnings below.
Notable Earnings
Coca-Cola (KO)
Coca-Cola’s organic revenue rose 10% in the first quarter, driven by 2% growth in price/mix and an 8% increase in volume. Comparable operating profit grew 12%, as margin expanded 70 basis points to 33.8% and comparable earnings per share grew 18% to $0.86.
Coca-Cola started the year on a strong footing, as its marketing, pricing, and innovation initiatives resonated well with consumers and helped the company gain market share in the total non-alcoholic ready-to-drink beverages market.
The company maintained its 2026 organic revenue growth guidance of 4%–5% but raised comparable EPS growth guidance to 8%–9% (from 7%–8%). Coca-Cola remains one of our core holdings. We view the shares as fairly valued at current levels, trading in line with their long-term average forward price-to-earnings multiple of 24.
Chart 1: Coca-Cola’s forward PE ratio (price to earnings ratio) (white line) and EPS ratio (earnings per share) (yellow line)

Source: LSEG
Alphabet (GOOGL)
Alphabet began 2026 with a very strong set of financial results. The firm’s sales grew 22% to $110 billion, with Google Cloud up 63% to $20 billion. The firm’s operating margins expanded 220 basis points, with services and cloud operating margins both expanding year over year.
A year ago, Alphabet was trading as if it had lost the artificial intelligence race. What a difference a year, and clear evidence that the firm is generating strong returns from AI, can make. The clearest evidence of this transformation is visible in Google Cloud, where sales accelerated both sequentially and year-over-year. We estimate that Gemini API revenue is now running at approximately $15 billion annually, up from a $9 billion run rate last quarter.
The firm’s core search business also continues to benefit from AI. We view AI overviews and AI mode as sound moves to stem customer churn to AI-enabled alternatives, while maintaining user engagement and driving search sales growth of 19% in the quarter.
We are raising our fair value estimate for wide-moat Alphabet. While the stock is trading above its five-year average price-to-earnings multiple, we believe the premium is justified by the company’s compelling growth outlook. Alphabet currently trades at 28 times earnings, with the valuation re-rating driven by growing conviction in the firm’s ability to monetize its custom silicon chips and scale profitable usage of its large language model, Gemini. Alphabet remains one of our top picks.
Chart 2: Alphabet’s forward PE ratio (price to earnings ratio) (white line) and EPS ratio (earnings per share) (yellow line)

Source: LSEG
Microsoft (MSFT)
Microsoft’s third-quarter results topped the high end of guidance. Revenue increased 15% year over year in constant currency to $82.9 billion, compared with the high end of guidance of $81.75 billion, while operating margin was 46.3%, compared with the high end of guidance at 46.1%.
Results were strong across the board, with headline numbers beating our already-aggressive expectations on both the top and bottom lines. All three business segments surpassed the high end of guidance. Most critically, we see meaningful strength in Azure across both traditional and artificial intelligence workloads.
Demand for Azure AI services is surging, which is a long-term positive. While Azure remains capacity-constrained, both traditional and AI workloads were strong. Azure growth was 39% in constant currency for the quarter and surpassed guidance of 37.5%, versus 84% growth in capital expenditure.
These results remain firmly consistent with our long-term thesis, which centers on the expansion of hybrid cloud environments, the proliferation of AI, and Azure’s dominant positioning within both. Our growth estimates are anchored by Azure, Microsoft 365 E5 migration, and continued traction with the Power Platform. Microsoft has faced headwinds over the past year alongside the broader software sector, as fears grew that AI would displace its core products.
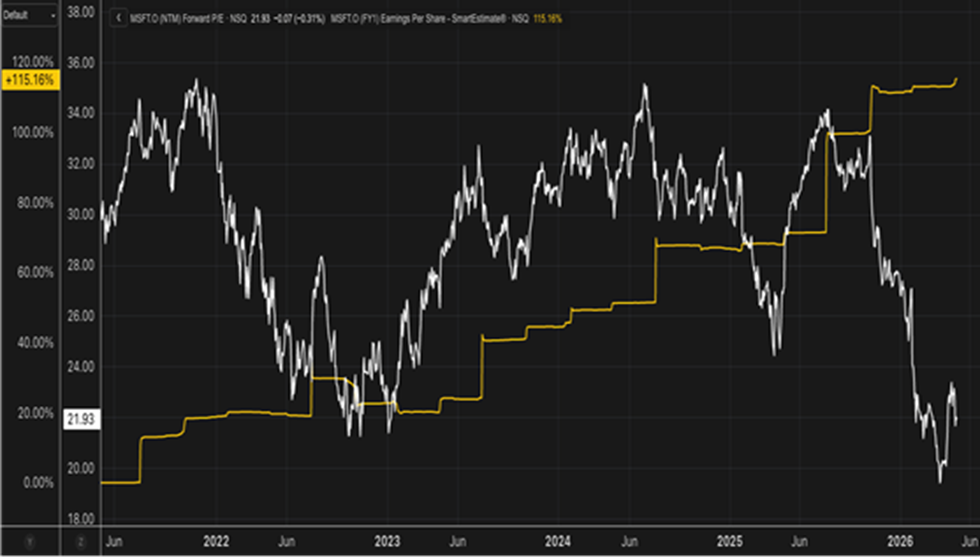
We view those concerns as overblown — and notably, even if AI does accelerate software disruption, Microsoft is well-positioned to benefit through Azure. At 25 times earnings, compared to over 35 times a year ago, we continue to view the current entry point as an attractive buying opportunity.
Chart 3: Microsoft’s forward PE ratio (price to earnings ratio) (white line) and EPS ratio (earnings per share) (yellow line)
Source: LSEG
Eli Lilly (LLY)
Eli Lilly reported 56% revenue growth and 156% non-GAAP EPS growth in the first quarter, and management raised full-year revenue guidance by $2 billion to a range of $82 billion-$85 billion, implying 28% growth at the midpoint. Shares rose 10% intraday on April 30.
With global volumes across Lilly’s portfolio rising 65%, the 13% price headwind had only a modest impact on gross margins, and the pace of revenue growth was sufficient to expand operating margins.
Foundayo’s April 2026 obesity launch is not yet reflected in first-quarter numbers, but management commentary was encouraging. The team highlighted an upcoming diabetes filing later this quarter, as well as a rapid expansion of commercial and Medicare coverage over the coming months. Eli Lilly remains a holding across our portfolios.
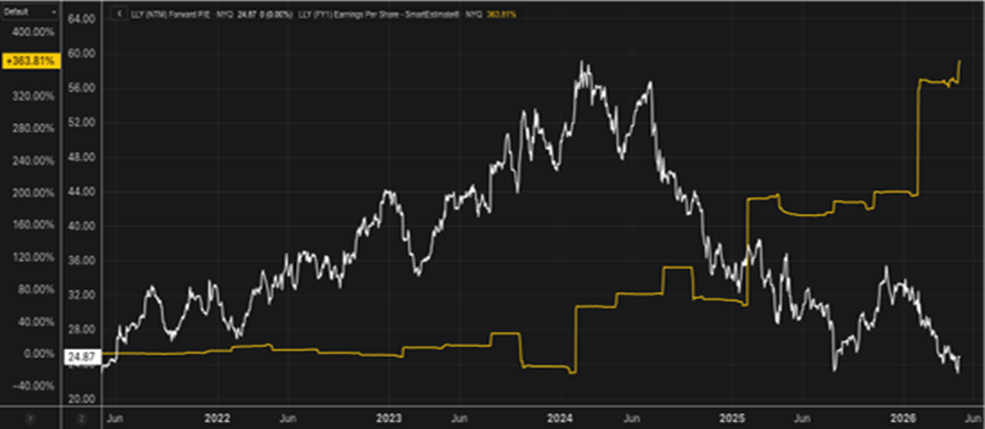
We continue to rate the company as attractively valued: it trades on a forward price-to-earnings multiple of just 26 despite growing revenue and earnings at a rapid pace. On a PEG ratio basis (price-to-earnings divided by growth rate), Eli Lilly trades at less than 1.0, a level that typically signals undervaluation in a high-growth company.
Chart 4: Eli Lilly’s forward PE ratio (price to earnings ratio) (white line) and EPS ratio (earnings per share) (yellow line)
Source: LSEG
Visa (V)
Despite the uncertain macroeconomic backdrop, consumer spending has remained resilient, supporting strong top-line growth for Visa in its fiscal second quarter. Visa’s net revenue increased 16% on a constant-currency basis, marking an acceleration from recent quarters.
Payment volume increased 9% year over year on a constant-currency basis, which is at the high end of the range we’ve seen in recent quarters. Relatively strong domestic growth was the main driver, with the US posting 8% growth. While macro trends remain positive for now, we still see near-term risk.
Constant-currency cross-border volume, excluding intra-Europe transactions grew 11% year over year during the quarter, in line with the past three quarters.
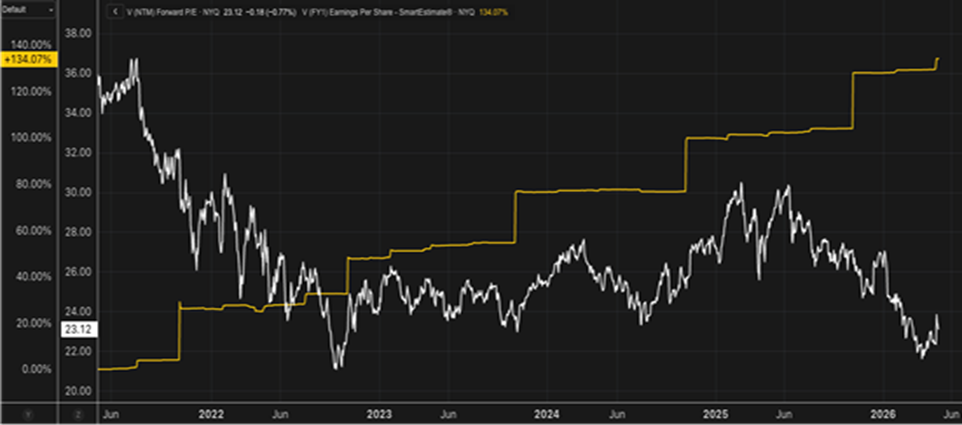
Visa has also derated meaningfully. The stock currently trades below its long-term average valuation, at a forward price-to-earnings multiple of 25 and a PEG ratio of below 2. We view these as compelling levels at which to build a position.
Chart 5: Visa’s forward PE ratio (price to earnings ratio) (white line) and EPS ratio (earnings per share) (yellow line)
Source: LSEG
Summary
Overall, we are highly encouraged by the earnings results, and forward guidance issued this season by most of the companies, both came in well ahead of what the market had feared. The data has reinforced our view that the economic impact of the war has been more contained than initially anticipated, and markets responded accordingly with a strong recovery in April. That said, we expect volatility to persist across most asset classes over the next six months, as the ultimate impact of the conflict on inflation and economic growth remains difficult to forecast with precision. We will continue to use any meaningful market weakness as an opportunity to add to our positions.
South African market overview
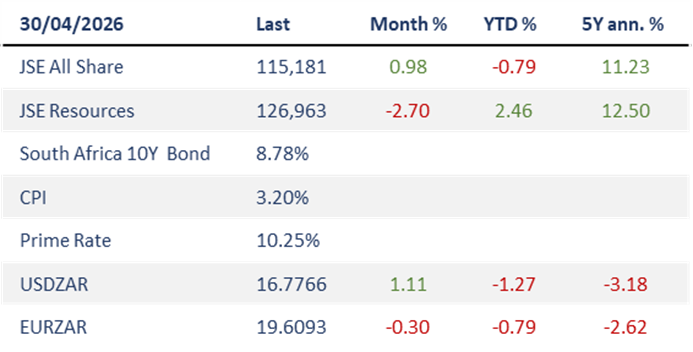
Source: Moneyweb, SARB
Headline inflation edged slightly higher to 3.1% in March, with fuel, food and imported goods keeping broader price pressures largely contained. However, rising rentals and services costs pushed core inflation higher than expected, signaling that underlying price pressures are beginning to build.
Looking ahead to April, the sharp jump in domestic fuel prices will feed directly into the headline number. Insurance costs will add further pressure, with Discovery, the country’s largest medical insurer, implementing delayed premium hikes. On balance, we expect inflation to remain on an upward trajectory through the coming months, with risks tilted to the upside should the conflict in the Middle East persist
Fuel turns from a drag to a driver
After acting as a cushion against broader price pressures earlier in the year, fuel is now set to become a meaningful inflation driver. The war-induced oil shock, combined with a weaker rand, is expected to push fuel costs sharply higher looking ahead, marking a significant turning point.
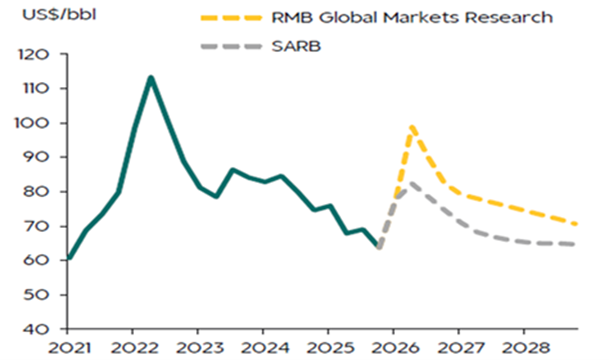
Our inflation outlook is considerably more cautious than the SARB’s, as we anticipate higher oil prices and a weaker currency persisting for longer. This points to a more elevated and prolonged fuel inflation path than official projections currently reflect.
Chart 6: We see Brent prices higher than the SARB…
Source: SARB, Bloomberg, RMB Global Markets Research
Chart 7:…and a weaker rand

Source: SARB, Bloomberg, RMB Global Markets Research
China opens its doors to South Africa
In a significant boost for the South African economy, China has extended its zero-tariff policy to include South Africa, opening up preferential access to one of the world’s largest and most dynamic consumer markets. The move offers meaningful relief at a time when global trade tensions remain elevated, and positions South Africa to capitalize on deepening ties with its largest trading partner.
Trade, Industry and Competition Minister Parks Tau welcomed the decision, highlighting the expanded export opportunities it creates for South African businesses. The timing is particularly encouraging, as it provides an important counterweight to the pressures posed by US tariffs elsewhere.
The relationship between South Africa and China is already one of considerable substance. Bilateral trade has grown by 33% over recent years, reaching $34 billion in 2023, and South Africa’s exports have continued to trend higher. The new policy now broadens the scope of what South Africa can competitively offer, moving beyond raw materials and commodities to include fruit, vegetables, wine and a wide range of agricultural products.
For South African exporters, this represents a genuine opportunity to diversify export revenues, grow market share and build lasting commercial relationships in a market of over a billion consumers. It is a development that deserves to be viewed with optimism.
Chart 8: 2026 EPS evolution of global indices: SA vs the rest of the world
Gold and PGM prices have driven strong SA earnings over the past 18 months:

Source: Nedbank CIB
Chart 9: Consensus EPS growth (USD terms)

Source: Nedbank CIB
VEGA Global Strategic Fund Update
April was an encouraging month for the VEGA Global Strategic Fund, with the fund staging a sharp recovery from March. Over the month, the fund returned 7.92%, while the MSCI All Country World Index, our reference benchmark, returned 10.03% in USD terms. While the benchmark outpaced the fund over the period, the strong rebound underscores the portfolio’s resilience and our conviction in the long-term opportunities we continue to identify and hold.
Chart 10: Total return in USD since inception

Portfolio strategy
In the wake of heightened market volatility following President Trump’s tariff announcements, our stance has been to remain disciplined and avoid reactive portfolio shifts. History consistently shows that impulsive responses to short-term political noise often result in suboptimal investment outcomes.
Instead, we have used this environment to evaluate high-quality businesses that were indiscriminately sold off despite their strong long-term fundamentals. Periods of uncertainty can create attractive entry points into quality companies at compelling valuations, and we continue to focus on identifying these opportunities with a long-term perspective.
The portfolio remains invested in leading global businesses with durable competitive advantages, particularly those delivering high returns on capital and robust free cash flow generation. Dividend policies are not a central consideration in our selection process, as we generally favour companies that reinvest earnings to drive future growth.
We also resist the temptation to follow short-lived market trends or fashionable investment narratives, as preserving portfolio quality takes precedence over chasing momentum.
Changes which were made during the month
Broadcom Inc. — Added Position
We initiated a position in Broadcom given our conviction in its dominant role across AI networking and enterprise software. The company’s diversified revenue streams and strong free cash flow generation offer a compelling risk-adjusted return profile, and we were pleased to establish exposure at an attractive entry point.
ARM Holdings — Added Position
We initiated a position in ARM Holdings given the company’s central and growing role in the global semiconductor ecosystem. Its asset-light royalty model and broadening end-market exposure across mobile, data centres and automotive present an attractive long-term earnings growth opportunity.
Alibaba Group — Removed Position
We exited our holding in Alibaba following a reassessment of the risk profile. While the company remains a significant technology franchise, ongoing regulatory uncertainty and subdued domestic consumer sentiment led us to conclude that the risk-reward balance had shifted unfavorably. The capital was redeployed into opportunities offering greater clarity.
Anglo American — Removed Position
We exited our holding in Anglo American following a period of satisfactory performance. While the company retains world-class mining assets, the near-term commodity outlook and ongoing structural complexities offered a less compelling risk-reward proposition relative to other available opportunities.
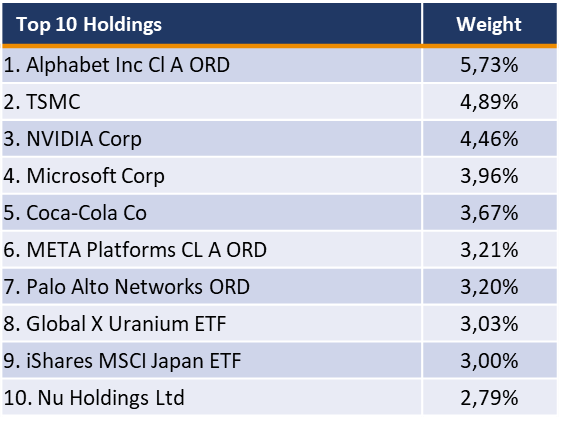
Top 10 Holdings
Monthly returns in USD net of fees

Share of the month: AMAZON (AMZN)

Business Strategy & Outlook
Amazon dominates two of the most strategically important industries in the global economy: e-commerce and cloud computing. Its scale, network effects, and continuous reinvestment have created a self-reinforcing competitive position that is difficult for rivals to replicate.
In retail, Amazon’s unmatched selection, low prices, and logistics infrastructure continue to drive market share gains. Prime memberships sit at the heart of the consumer relationship, generating recurring high-margin revenue while locking in customers who shop more frequently, across more categories, and with larger basket sizes.
AWS and advertising are the critical medium-term growth drivers. Both segments carry substantially higher margins than the corporate average, meaning their continued outperformance will drive meaningful operating leverage. AWS is growing at 28% year over year and is now at a $150 billion annual run rate, fueled by both traditional enterprise workloads and surging AI demand.
Advertising revenue, driven by proprietary consumer data and high-intent purchase behavior, is expected to grow at an 18% five-year CAGR and is likely the highest-margin segment in the portfolio, with operating margins estimated above 30%.
Economic Moat
We assign Amazon a wide economic moat, supported by network effects, cost advantages, intangible assets, and switching costs across all major business segments. Critically, we believe the moat for the business as a whole exceeds the sum of its parts, as each segment reinforces the others.
Key moat sources:
- Retail: A two-sided marketplace network effect where more buyers attract more third-party sellers, and vice versa. Approximately 60% of goods sold flow through the third-party marketplace.
- Cost advantage: With over $800 billion in 2024 gross merchandise value, Amazon has unrivalled purchasing power, route density, and vertical integration through its own transportation network and proprietary devices.
- AWS: Enterprise customers face high switching costs due to deep integration with mission-critical infrastructure. Data fees and the complexity of migration further entrench existing clients.
- Advertising: Proprietary data on hundreds of millions of users, combined with real-time purchase-intent signals, provides advertisers with targeting capabilities unavailable elsewhere at this scale.
Financial Strength
Amazon’s balance sheet is in strong shape, with $123.0 billion in cash and marketable securities against $65.6 billion in debt as of 31 December 2025. Revenue grew 15% year over year in Q1 2026 to $181.5 billion, with operating income of $23.9 billion comfortably exceeding guidance.
Free cash flow is temporarily constrained by the significant AWS data centre expansion programme. As this investment cycle matures, we anticipate a return to more normalized and substantial cash generation. The company’s scale and earnings power from AWS and advertising provide ample internal funding capacity for ongoing growth initiatives.
Capital Allocation
We assign Amazon an Exemplary Capital Allocation rating. Management has a remarkable track record of investing in areas that were initially met with scepticism but were ultimately vindicated, including AWS, Prime Video, and the proprietary logistics network.
Current priority investments include Project Leo (satellite internet), the AWS data centre expansion, and warehouse automation. The company does not pay dividends or repurchase shares, with capital deployment firmly prioritized toward growth. CEO Andy Jassy, a 23-year Amazon veteran and the architect of AWS, continues to execute with discipline through the generative AI investment cycle.
Key Risks
- E-commerce competition: Traditional retailers continue to bolster their online presence, and post-covid consumer behavior shifts require ongoing investment to maintain category leadership.
- Regulatory and antitrust exposure: Lawmakers in the US and internationally have scrutinized Amazon’s market power. Antitrust, data privacy, and protectionist policies in international markets remain ongoing risks.
- AWS capital intensity: The scale of data centre investment required to serve AI workloads represents a sustained near-term pressure on free cash flow and returns.
- Cybersecurity and data risk: As both a major retailer and cloud host of mission-critical enterprise data, Amazon faces material exposure to data breaches and service outages.
Same as Ever – Chapter 9: Too much, too soon, too fast.
In Chapter 9, Morgan Housel explores a pattern that appears across nature, business, and investing: many things that work beautifully at one size or speed begin to break when pushed beyond their natural limits. The chapter opens with the story of Robert Wadlow, the tallest human ever recorded. His abnormal growth, rather than making him superhuman, left him barely able to walk and dependent on steel braces just to stand. He died at 22. The story is striking precisely because it defies our instinct to assume that more of something good is simply better. Growth, Housel argues, is not inherently a virtue. It is a process that operates well within certain boundaries and fails when those boundaries are ignored.
He draws on the biologist J.B.S. Haldane’s observation that a flea enlarged to the size of a human being would not be able to jump thousands of feet. It would barely be able to hop. The mechanics that work at small scale collapse under different conditions. This concept, Housel shows, applies far beyond biology. Starbucks serves as a compelling business example. For years its growth was celebrated. But when expansion became the strategy rather than a byproduct of quality, the cracks began to show. Disappointed customers scaled faster than revenue. The business that had worked so well at one size became unwieldy at another.
The same logic applies to financial markets. The long-run returns from equities are genuinely compelling. But when investors attempt to compress those returns into a shorter timeframe, everything changes. The very impatience that seems reasonable in the moment is what creates the conditions for loss. Housel’s point is not that ambition is misguided, but that great outcomes are often inseparable from the time and conditions required to produce them. Trying to shortcut the process tends to destroy the very thing being pursued.
The psychology behind it
At the core of this chapter is a tension that most people feel but rarely examine directly: the gap between what something is worth and how quickly we want to receive it. We see the destination clearly and assume the path should match our urgency. But Housel argues that patience is not simply a virtue in investing, it is structural. The market does not reward impatience. It punishes it, consistently and without exception.
There is also something deeper at work. When things are going well, the temptation to accelerate is strongest. A business growing steadily invites the question of whether it could grow faster. A portfolio performing well invites the question of whether it could perform better with more leverage. These questions feel rational. But they misunderstand why things were working in the first place. The conditions that produced the results were inseparable from their pace and scale. Changing either one changes the outcome.
What This Means for Investors
For investors, Chapter 9 is a direct challenge to one of the most common behavioral errors: the desire to have long-term results on a short-term timeline. Virtually every major investing mistake can be traced back to someone looking at what the market delivers over a decade and asking whether they can have it in a year. The answer is always the same. Sometimes it appears to work for a while. But the mechanics do not support it, and the consequences eventually arrive.
The practical implication is not complex, though it is genuinely difficult to apply. A portfolio built for the long run needs to actually be held for the long run. That means resisting the pull of leverage when returns look attractive, avoiding the temptation to concentrate when confidence is high, and understanding that the most convenient investing time horizon is likely longer than feels comfortable in any given moment. The best outcomes in investing, as in nature and business, tend to belong to those who respect the pace at which good things actually grow.
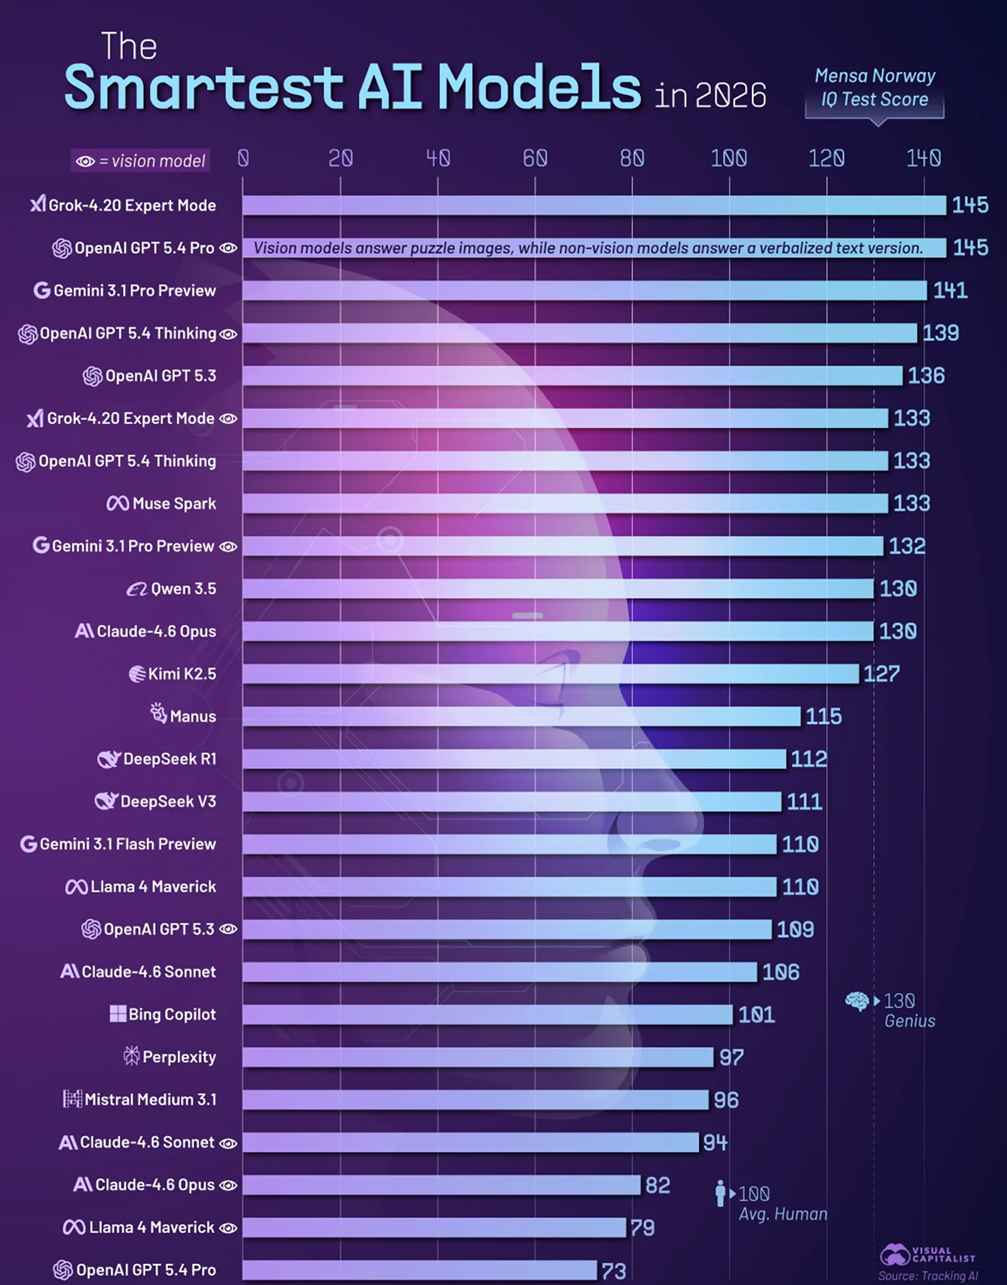
Graph of the month
Source: Visual Capitalist
Sources
Alpine Macro, Anchor, Bloomberg, BNY Mellon, Charlie Bilello, Compound Advisors, Edmond De Rothschild, ETFMG, FactSet, Haver Analytics, JP Morgan, Julius Baer, LSEG, Morningstar, Morgan Stanley, Refinitive, RMB, Statista, Sygnia, Strategas, The Intelligent Investor, UBS.
Disclaimer
VEGA Asset Management has taken care that all information provided in this document is true and correct. VEGA Asset Management does not accept responsibility for any claim, liability, loss, expense, or damage. Any information herein is not intended nor does it constitute financial, tax, legal, investment, or other advice. VEGA Asset Management is an authorised Financial Service Provider with FSP number 776. Past performance is not necessarily an indication of future performance.