July 2026 Newsletter
The July 2026 VEGA Newsletter examines a turbulent but resilient first half of the year, from shifting interest-rate expectations and concentrated equity market gains to South Africa’s evolving economic outlook. We also review the VEGA Global Strategic Fund, assess the investment case for SpaceX, and explore why patience remains one of the most powerful forces in long-term investing.
Categories:
Date Posted:
July 15, 2026
Highlights of this month’s newsletter:
“When small men begin to cast big shadows, it means that the sun is about to set.””
― Lin Yutang
Market overview: performance figures (%)
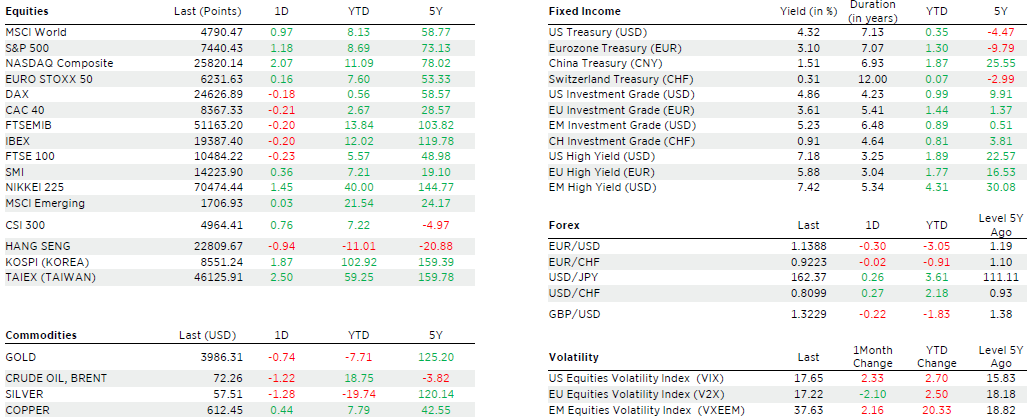
Source: Edmond de Rothschild, 30.06.2026
International market overview
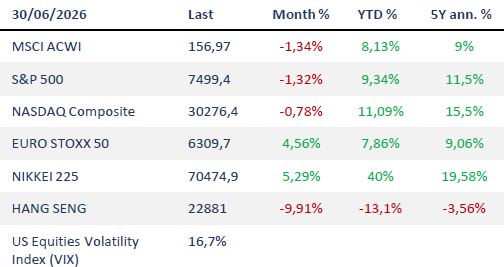
Source: Edmond de Rothschild
We have reached the halfway mark of 2026, and it has been another eventful six months. There is little need to dwell on the reasons behind the volatility and uncertainty in markets, as they are by now well understood: the dominant drivers have been President Trump’s tariffs and the war in the Middle East. This report examines the effects of the war and the path forward in greater detail. Another notable market-moving event in the first half of 2026 was the IPO of SpaceX, which we cover in depth in the share of the month section.
European and US Rates
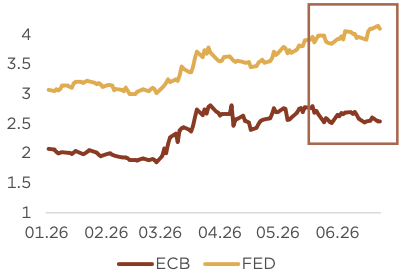
The Federal Reserve, now chaired by Kevin Warsh, left its target range unchanged at 3.50%–3.75% but adopted a markedly more hawkish tone. Its new projections point to a slight tightening by year-end, breaking with the previous scenario of rate cuts. Inflation forecasts were revised higher, with headline PCE inflation now expected at 3.6% in 2026 and core PCE inflation at 3.3%. The accompanying statement was shorter and significantly reduced forward guidance, with Warsh reiterating that price stability remains the top priority. A more dovish ECB and a more hawkish Fed are now driving a widening gap in expected rates between the two regions.
Chart 1: Expected rates for December 2026, US vs EU
Source: Edmond de Rothschild
Markets performed well however volatility was elevated
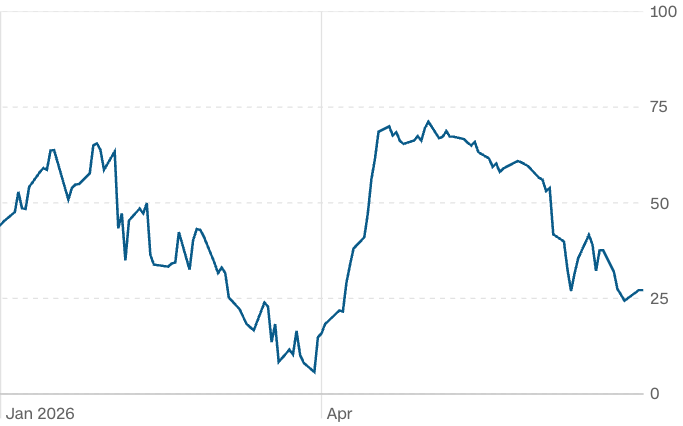
The two dominant trades in the market over the past year have been semiconductors and oil. Markets performed well overall, but with exceptionally elevated day-to-day swings. CNN compiles a Fear and Greed Index, which draws on data points such as market volatility, market breadth, and the put-to-call ratio, among others. It offers a useful gauge of prevailing sentiment and a sense of the volatility and confusion generated by political leaders. A reading above 50 indicates a greedy or optimistic market, while a reading below 50 signals a fearful or pessimistic one. The large swings in the index over the year illustrate just how volatile conditions have been.
Chart 2: Fear and Greed index
Source: CNN
Highly concentrated performance
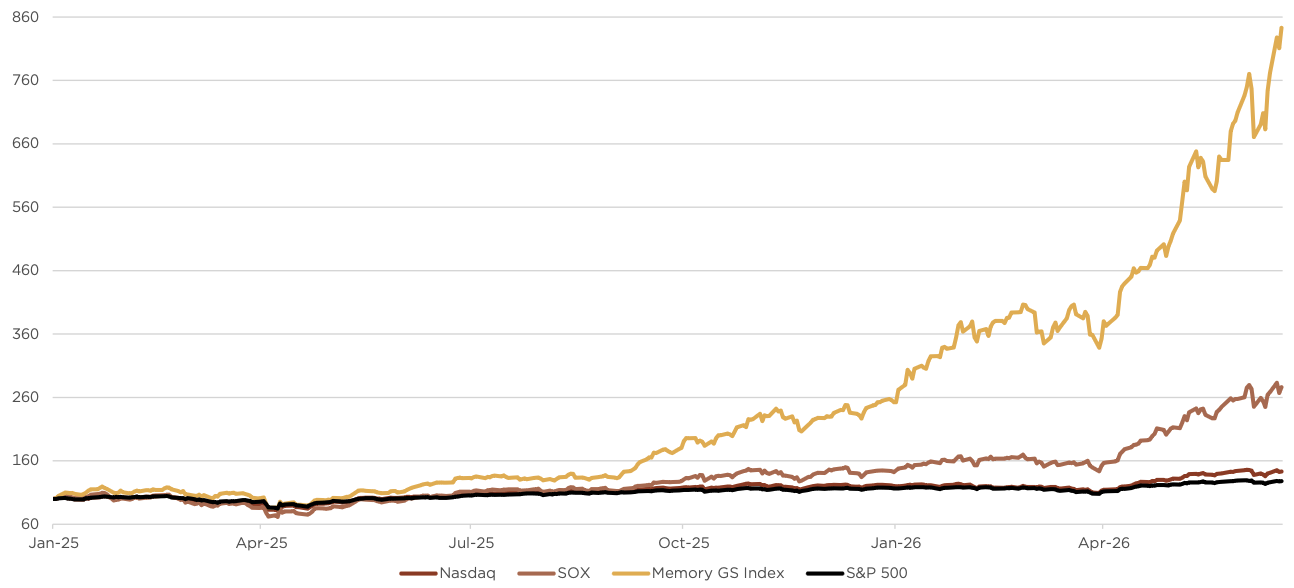
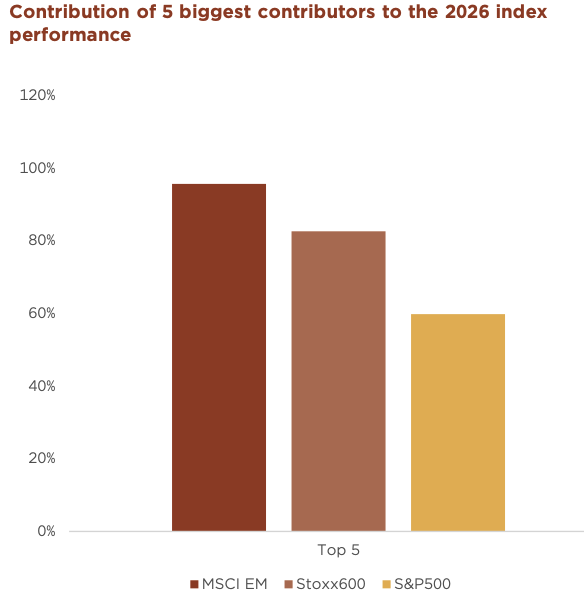
The technology sector has been propelled by a strong rally in semiconductor stocks since January 2025, led in particular by memory and CPU names exposed to the AI infrastructure theme. Graph 3 shows the performance of the Nasdaq (dark brown line), the semiconductor index (SOXX, light brown line), the memory chip index (gold line), and the S&P 500 (black line). Graph 4 illustrates that the majority of returns came from just five shares. Close to 100% of emerging market returns can be attributed to only five stocks.
Chart 3: Performance of the Nasdaq, S&P 500, SOX, and memory chip shares since January 2025
Source: Edmond de Rothschild
Chart 4: Contribution of the five largest contributors to 2026 index performance
Source: Edmond de Rothschild
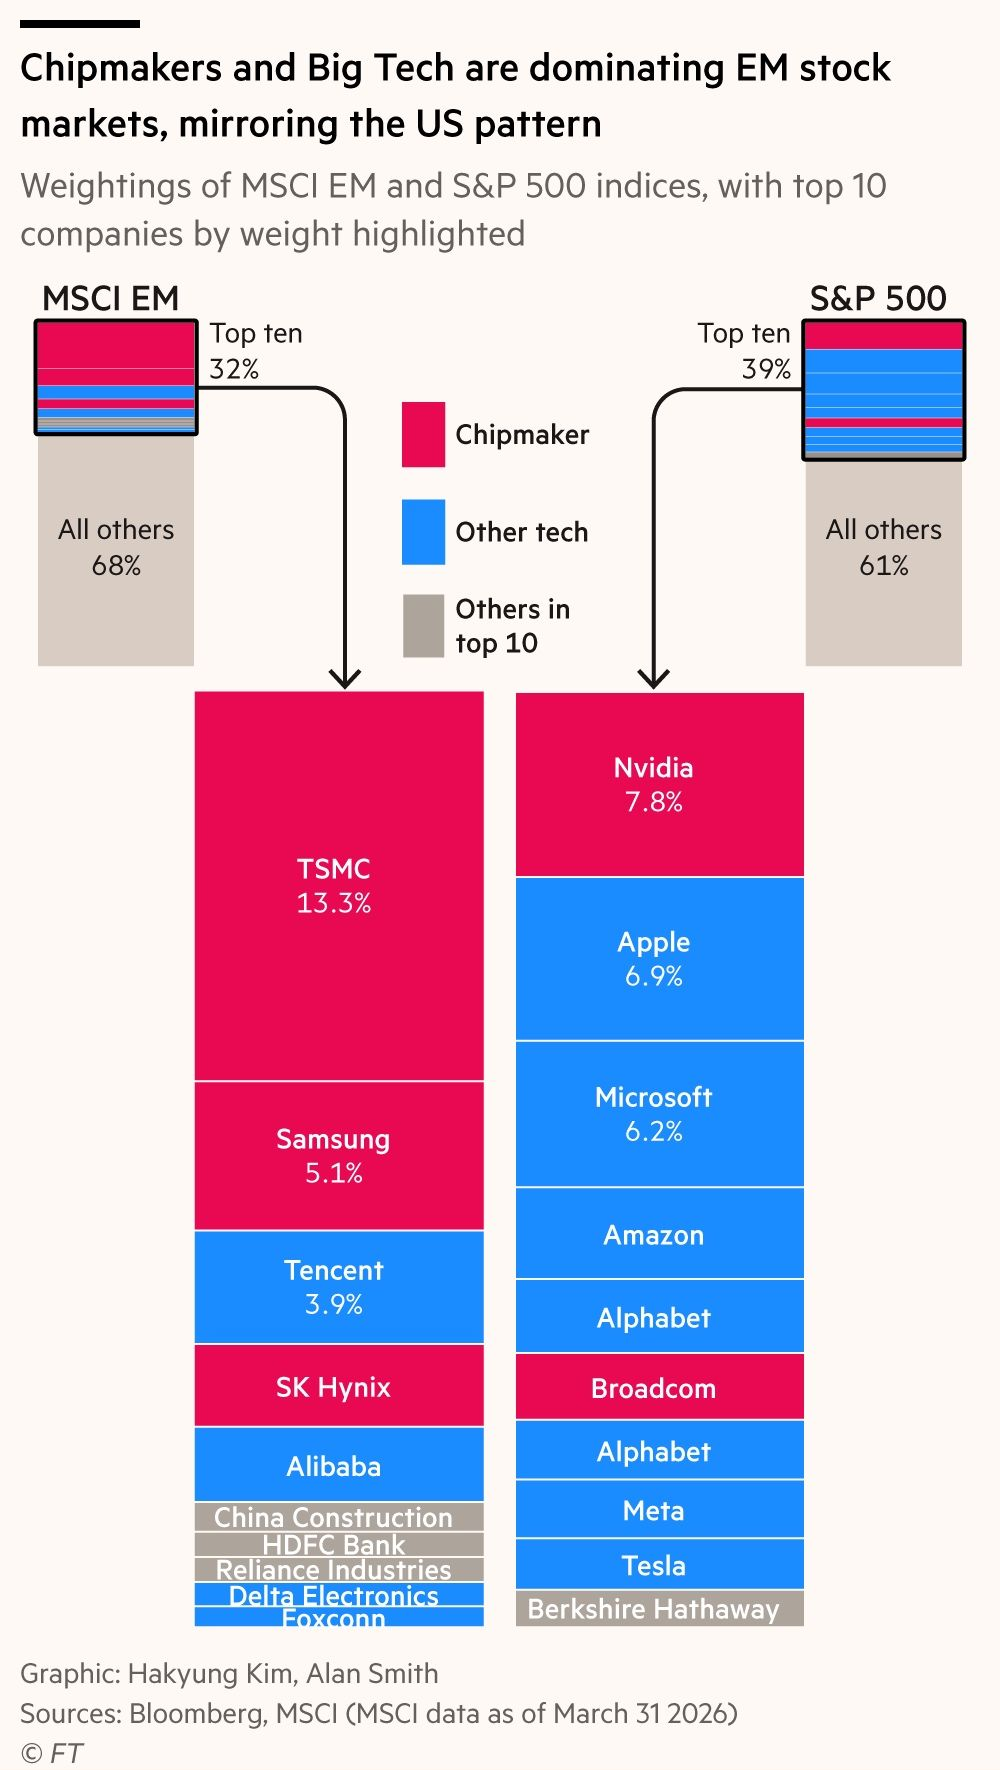
Although we see merit in the rise in memory share prices, we remain reluctant to run a concentrated portfolio and would rather stay diversified. Indices are becoming increasingly concentrated, and many investors mistakenly assume that these passive strategies are well diversified. Graph 5 illustrates just how concentrated the S&P 500 and emerging market indices have become. Passive strategies work out well if the concentrated positions do well, in this case semiconductors, however they will lag active funds when momentum shifts to other sectors.
Chart 5: Chipmakers and Big Tech are dominating emerging market stock markets, mirroring the US pattern
Source: Edmond de Rothschild
Equity markets outlook
Equity market leadership has rotated back towards the US following the recent spike in geopolitical tensions and energy prices. In this environment, higher oil prices have disproportionately weighed on energy-importing regions, while the US has benefited from its structural exposure to AI and strong earnings momentum. This renewed US leadership is not solely a function of macroeconomic dynamics, it is also firmly supported by underlying fundamentals. The first quarter of the year delivered the strongest earnings growth in four years, driving meaningful upgrades to forward expectations. At the same time, hyperscalers once again exceeded capital expenditure forecasts, reinforcing confidence that the AI investment cycle remains firmly on track. Importantly, the rebound in sentiment reflects easing concerns rather than excess optimism, pointing to a market driven by fundamentals. Graph 6 illustrates the strong earnings growth of US companies.
Chart 6: Earnings-per-share estimates and historical figures for the S&P 500
Source: Edmond de Rothschild
AI remains the dominant market driver. The investment cycle continues to accelerate, supported by strong capital expenditure and rising demand for data centre capacity, while emerging signs of monetisation are reinforcing earnings growth.
We do not see evidence of a broad-based AI bubble. While valuations in parts of the ecosystem are elevated, market performance has been driven primarily by strong, sustained earnings growth rather than by the expansion of valuation multiples. Data centre demand continues to outpace supply, and there are clear signs of improving monetisation. In addition, unlike in previous cycles, today’s AI leaders are highly profitable and cash-generative.
US Dollar
We do not see a deliberate US strategy to debase the dollar; on the contrary, the US has a clear interest in preserving the dollar’s reserve currency status. The higher oil prices that followed the outbreak of the Iran war support the USD, with the US having shifted from a net importer to a net exporter of energy. In our view, the dollar is more likely to weaken gradually, driven by structural imbalances and diversification into other currencies.
Summary
Overall, equities are supported by strong earnings and powerful structural drivers, but selectivity across regions, sectors, and themes will be critical to capturing the next phase of the equity cycle. That said, Kevin Warsh appears less dovish than expected and the hype surrounding SpaceX’s IPO seems exaggerated in the short term, both of which could lead to increased volatility. We also stress that diversification is key. Even when a theme or share stands out, we remain reluctant to commit the majority of a portfolio to it. Over the longer term, a diversified portfolio of quality shares will drive outperformance and reduce risk, even if this strategy lags more concentrated indices and funds over shorter periods.
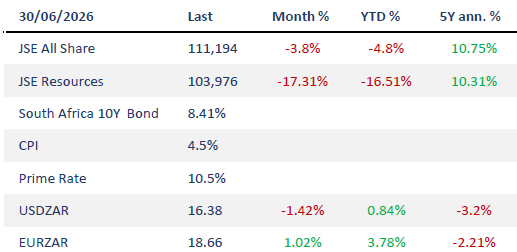
South African market overview
Source: Moneyweb, SARB
March and protest effect: The costs on SA markets
June’s anti-immigration protests, culminating in a June 30 “deadline” for undocumented foreigners to leave, carried a direct price tag — over R600 million in police deployment costs alone. For market watchers, the more significant question is what episodes like this mean for South Africa’s investment narrative. Political and social instability, even when contained, tends to surface in risk premia and FDI flows over time. The July 2021 riots offer a useful reference point: estimated damage of R50 billion, nearly two million jobs affected, and multinationals such as Toyota publicly reassessing their South African exposure.
Naspers: Our tech holding completes its pivot
Our JSE-listed technology holding reported full-year results to 31 March 2026 that confirm its shift away from Tencent dependence and towards being an operator in its own right — what management badges “Prosus Plus”. Ecosystem revenue rose 12% in local currency to US$9.7bn, while ecosystem adjusted EBITDA jumped 44% to US$1.3bn, with all three regional ecosystems namely Latin America, Europe and India now profitable. Free cash flow excluding Tencent reached a record US$275m, and core headline earnings per share grew 24%, amplified by the buyback. The group has now returned US$46bn through repurchases, doubled its dividend, and guided to a further US$5bn buyback in FY27.
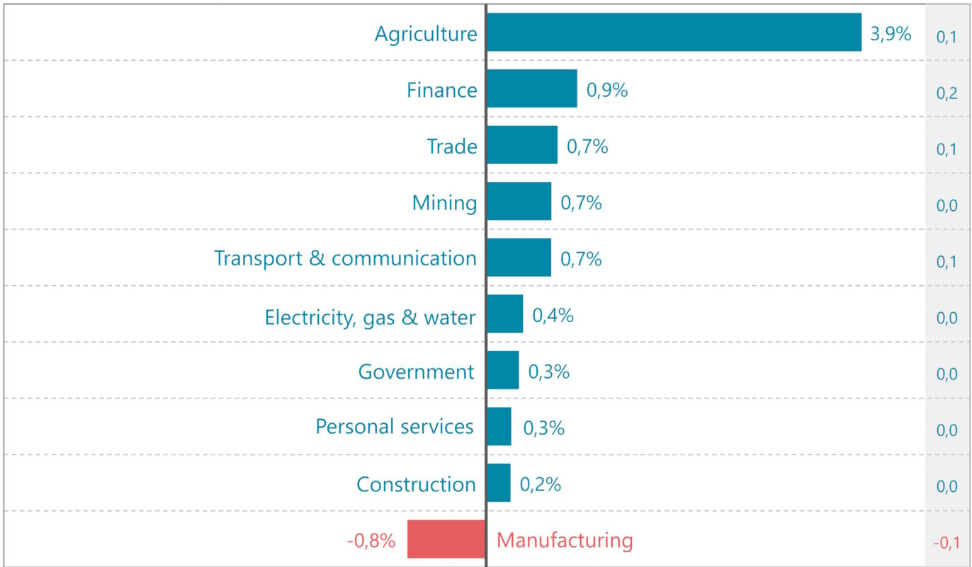
SA growth surprises: Q1 GDP beats
After two holds and a defensive 25bp hike to 7% in late May, June’s focus shifted to growth. Stats SA reported that GDP expanded 0.5% quarter-on-quarter in the first quarter, ahead of the 0.3% economists had forecast and up from 0.4% in Q4 2025. The data largely predates the escalation of the Middle East conflict, so it does not yet reflect the energy shock and supply-side disruptions. Still it showed an economy with more underlying momentum than feared. Combined with the post-conflict easing in oil, the print helped the rand firm and gave the SARB room to pause at its July meeting.
Chart 7: Industry growth rates and contributions
Source: StatsSA
July fuel relief: The shock reverses
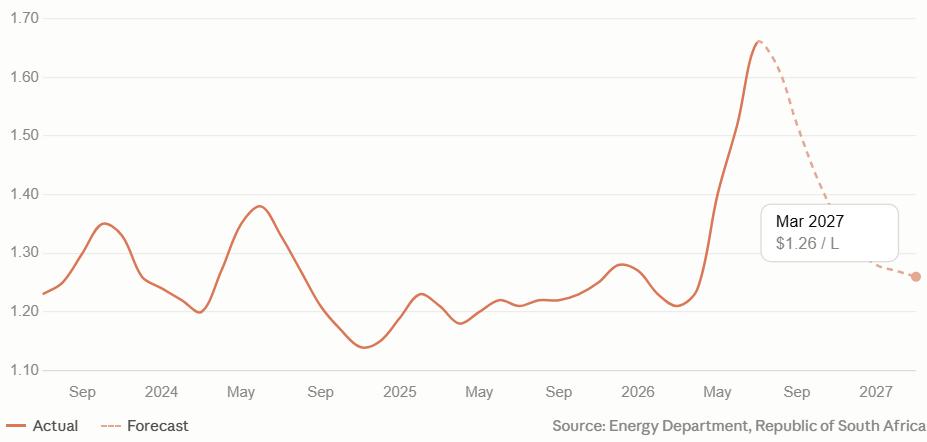
After four months of relentless hikes that pushed the petrol price to a record R28.06 per litre, a US-Iran ceasefire sent oil prices tumbling and set up the biggest fuel cut of the year. Following the reopening of the Strait of Hormuz, Brent fell into the mid-$70s, and with the rand around R16.60, local over-recoveries reached multi-year highs.
The cuts arrive even as the final tranche of the temporary fuel-levy relief expires on 1 July, adding R1.50/l to petrol and R1.96/l to diesel. Net of the levy, petrol 93 is projected to fall around R1.32/l, with diesel down over R4/l, real relief for transport, logistics and the consumer.
Chart 8: South African gasoline price
Source: Trading Economics
Inflation expectations drift higher
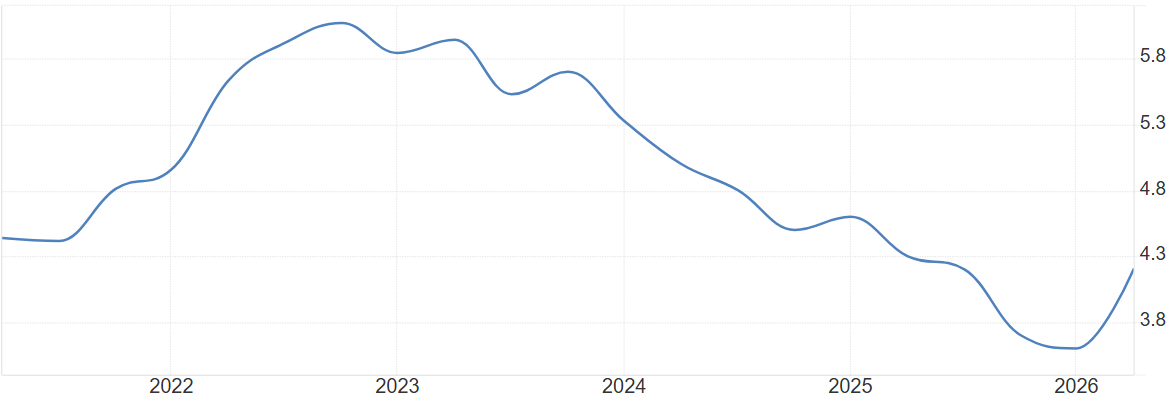
A fresh complication has emerged for the SARB’s inflation fight: expectations themselves are creeping up. The Bureau for Economic Research’s Q2 survey showed two-year inflation expectations rising to 3.9% from 3.6%, a key gauge the central bank watches closely when setting policy. Between survey rounds, annual inflation accelerated to 4.5% from 3% as fuel prices hit a record. Governor Lesetja Kganyago has flagged this as the real risk: not the initial oil shock itself, but price-setters across the economy beginning to expect higher inflation as the new normal, which can entrench the problem regardless of where global oil prices go next. Notably, the survey predates the US-Iran ceasefire and reopening of the Strait of Hormuz, which has since pulled fuel prices lower, meaning the next reading may look more favourable. The SARB next meets July 23, having already hiked rates in May.
Chart 9: South African inflation expectations
Source: Trading Economics
VEGA Global Strategic Fund Update
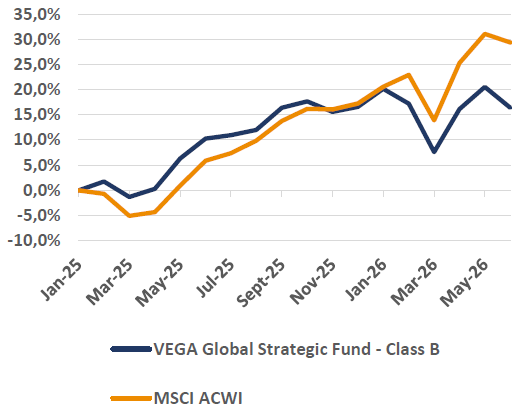
June gave back some of the autumn rebound, with the VEGA Global Strategic Fund declining 3.6% over the month while the MSCI All Country World Index, our reference benchmark, fell a more contained 1.4% in USD terms. After the strong April and May recovery, June’s pullback left the fund marginally lower at -0.4% year to date, against the benchmark’s 10.7%. We remain confident that the quality businesses we hold will continue to compound as conditions normalise.
Chart 10: Total return in USD since inception
Portfolio strategy
In the wake of heightened market volatility following President Trump’s tariff announcements, our stance has been to remain disciplined and avoid reactive portfolio shifts. History consistently shows that impulsive responses to short-term political noise often result in suboptimal investment outcomes.
Instead, we have used this environment to evaluate high-quality businesses that were indiscriminately sold off despite their strong long-term fundamentals. Periods of uncertainty can create attractive entry points into quality companies at compelling valuations, and we continue to focus on identifying these opportunities with a long-term perspective.
The portfolio remains invested in leading global businesses with durable competitive advantages, particularly those delivering high returns on capital and robust free cash flow generation. Dividend policies are not a central consideration in our selection process, as we generally favour companies that reinvest earnings to drive future growth.
We also resist the temptation to follow short-lived market trends or fashionable investment narratives, as preserving portfolio quality takes precedence over chasing momentum.
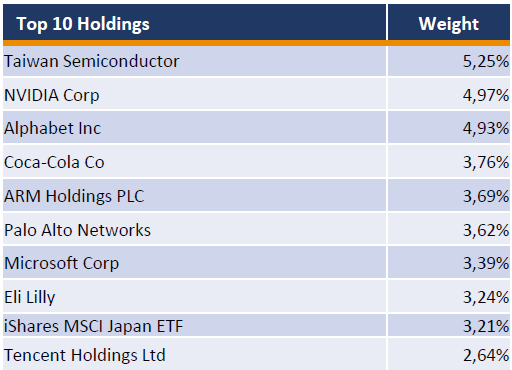
Our Top Holdings:
Taiwan Semiconductor Manufacturing Co.
Our largest position, TSMC is the world’s leading semiconductor foundry and manufactures advanced chips for virtually every major technology company. Its unmatched process technology is indispensable to the high-performance computing industries.
NVIDIA Corp
The dominant supplier of AI accelerators, NVIDIA has become the infrastructure backbone of the artificial intelligence era. Its CUDA software ecosystem creates deep customer loyalty, while sustained hyperscaler investment in AI infrastructure supports a prolonged period of earnings growth.
Alphabet Inc
Parent company of Google and the world’s leading digital advertising platform, Alphabet combines exceptional free cash flow with growing exposure to enterprise cloud through Google Cloud. The company is well positioned to benefit from both its core advertising franchise and the ongoing AI transition.
Coca-Cola Co
One of the world’s most recognised consumer brands, Coca-Cola operates an unrivalled global distribution network across over 200 countries. Its strong pricing power and resilient demand characteristics make it a reliable compounder of earnings through varying market conditions.
ARM Holdings PLC
ARM designs the processor architectures that power the vast majority of the world’s mobile devices and is increasingly central to AI inference at the edge. Its royalty-based model delivers highly scalable earnings with minimal capital requirements, with growing royalty rates positioning the company well.
Top 10 Holdings
Monthly returns in USD net of fees

Share of the month: SPACEX
Investment Case | Narrow Moat | Exemplary Capital Allocation | Share Price: $153.23/share
Business strategy & outlook
SpaceX is a vertically integrated conglomerate built around global dominance in space-centric infrastructure. Its core strength is delivering payloads to orbit at unmatched scale, frequency, reliability and cost efficiency. They hold more than 80% of global mass delivered to orbit and have cut launch cost per kilogram by over 95%. Other business lines, from Starlink to future orbital initiatives, are ultimately derived from and enabled by this leadership in low-cost space transportation.
The cost advantage is driven by a reusable launch architecture: repeatedly reusing boosters lowers per-launch costs and spreads fixed manufacturing costs across many missions. The Falcon 9 has been the workhorse, but the next-generation Starship could further cut launch costs, lift payload capacity and widen the range of economically viable orbital applications. We expect Starship to scale by around 2029, widening the firm’s lead, improving Starlink’s economics and unlocking new models across communications, logistics and space infrastructure.
The firm’s current market value is contingent on paving the way for novel revenue streams such as orbital computing, which we believe are possible given its unique advantages.
Economic Moat
We assign SpaceX a narrow economic moat, anchored by a widening cost advantage in its space and connectivity businesses. Extensive R&D to make rockets reusable, lightweight and powerful makes them cheaper per unit of payload mass, but uncertainty around its ambitions caps the rating at narrow.
Key moat considerations:
- Cost advantage: Each launch, (especially when reusing equipment) further lowers average cost, and the long lead is hard for imitators to replicate.
- Launch dominance: In 2025 SpaceX lifted 83% of mass to orbit. This is nearly 10x the nearest competitor, and ran 51% of all launches.
- Starlink inherits the moat: The only satellite operator with fully vertically integrated launch, using in-house launch cost and pushing the combined business down the learning curve.
- Competitors far behind: Arianespace, ULA, Blue Origin and Chinese ventures are each hundreds of cumulative launches behind in cadence and capacity.
- AI caps the moat: Orbital data-centre economics are unproven and capital-intensive, limiting the overall moat to narrow, while X is judged to have no moat.
Financial Strength
SpaceX’s balance sheet reflects an aggressive investment phase. As of Q1 2026 it held about $30 billion of debt and $16 billion of cash; a net debt position of around $14 billion against $92 billion of total assets. At 4.3 times adjusted EBITDA, leverage is on the high side but not extreme for a private company.
Much of the debt relates to AI-infrastructure investment, including a $20 billion bridge loan maturing 15 months after the planned IPO. The IPO targets gross proceeds of $50–80 billion at roughly a $1.75 trillion valuation, earmarked for R&D, AI infrastructure and Starlink deployment.
Starlink would be the main near-term cash flow contributor, with operating profits exceeding $5 billion in 2026. Its high operating leverage should let revenues scale rapidly and offset Starship R&D and cash burn in earlier-stage businesses.
Capital Allocation
We assign SpaceX an Exemplary Capital Allocation rating, with a reasonably sound balance sheet, exceptional investment performance and appropriate shareholder distributions. The firm has generally run a net cash position, though aggressive AI spending has lifted debt; the IPO should improve liquidity. With Starlink’s cash generation and IPO proceeds, management should be able to fund organic investment without further external financing for now.
Given SpaceX’s early lifecycle and breadth of opportunities, the absence of dividends or buybacks is appropriate. Reinvesting into Starship, Starlink and adjacent space-based opportunities should generate higher long-term returns. Management has an extraordinary record of innovation and execution. We do not view cash burn in AI and orbital data centres as inherently negative.
Key Risks
- Execution & technology: The thesis depends on Starship, which has yet to demonstrate scalable upper-stage reusability; Starlink also faces spectrum, regulatory, latency and capacity constraints.
- Aggressive valuation: The stock trades at a 147% premium to its $62 fair value, implying investors wait decades for earnings to grow into the multiple, with orbital-AI economics still unproven.
- Governance & key-person risk: A dual-class structure leaves Musk with ~85% voting control and minority holders little influence; the Feb 2026 xAI merger was a related-party deal, and Musk’s many roles amplify key-person risk.
- Share supply: After the IPO of just under 5% of shares, the remaining ~95% can be sold by insiders within a year, which could test demand and drive volatility.
Source: Morningstar
Same as Ever – Chapter 11: When The Magic Happens
Morgan Housel opens Chapter 11 with an observation that reshapes how we ought to think about progress and setback: good things almost always take a long time, while bad things tend to happen quickly. A market can shed a third of its value in a matter of weeks, yet recovering that value and compounding it to new highs can take many years. A company built patiently over a generation can unravel in a single quarter. A reputation assembled over decades can be undone in an afternoon. The asymmetry is everywhere once you begin to look for it, and it has profound consequences for how we perceive the world.
The reason for this imbalance, Housel argues, is structural. Good outcomes are the product of compounding, and compounding by its nature requires time, patience, and the steady accumulation of small advantages. Bad outcomes, by contrast, are usually the result of a single point of failure or a sudden loss of confidence, both of which can occur in an instant. A fortune is built slowly and lost rapidly. An aircraft is engineered over years and brought down in seconds. The things we value most are slow to create and alarmingly quick to destroy.
This asymmetry distorts our perception in a particular way. Tragedies are events, and events are easy to notice, report, and remember. Miracles, by contrast, tend to be processes, and processes unfold so gradually that they slip past our attention entirely. The result is a world in which the dramatic and the negative dominate the headlines, while genuine, durable progress accumulates quietly in the background. We end up far more aware of what is breaking than of what is slowly being built.
The Psychology Behind It
There is a deep evolutionary logic to this tendency. For most of human history, sudden danger demanded an immediate response, while slow improvement could safely be ignored. A predator required instant attention; a gradual rise in food supply did not. We are therefore wired to react sharply to fast, visible threats and to overlook the slow, invisible gains that ultimately matter far more. The setback commands our emotions while the steady progress barely registers.
This is also why pessimism so often sounds more intelligent than optimism. A warning of imminent collapse feels urgent, sophisticated, and worth heeding. A forecast of slow, steady, unremarkable progress sounds naive by comparison, even a little foolish. Yet over long stretches of history the optimists have generally been proven right, not because the world is free of disaster, but because compounding quietly does its work in the spaces between the crises. The patient accumulation of progress is real, even when it is difficult to see.
The danger this creates for investors is considerable. We tend to overweight recent, vivid, dramatic events and to underweight the long, quiet grind of improvement. We extrapolate the crash and forget the recovery that historically followed it. In moments of fear, the sudden downside feels permanent and the eventual upside feels impossible, and that distortion is precisely what drives so many costly decisions. The emotional weight of the overnight tragedy crowds out the rational expectation of the long-term miracle.
What This Means for Investors
For investors, the lesson of Chapter 11 is both simple and demanding. Wealth is built slowly, through the patient work of compounding, but it can be damaged very quickly through panic and poor decisions made in the heat of a frightening moment. The central task is therefore to survive the fast downside so that one remains in a position to benefit from the slow upside. A single impulsive reaction to a sudden shock can undo decades of disciplined progress, which is why guarding against that impulse matters as much as any investment decision itself. The practical implication is to act on the long-term reality rather than the short-term drama. Declines are sudden, loud, and emotionally overwhelming, but they have historically proven temporary.
Graph of the month
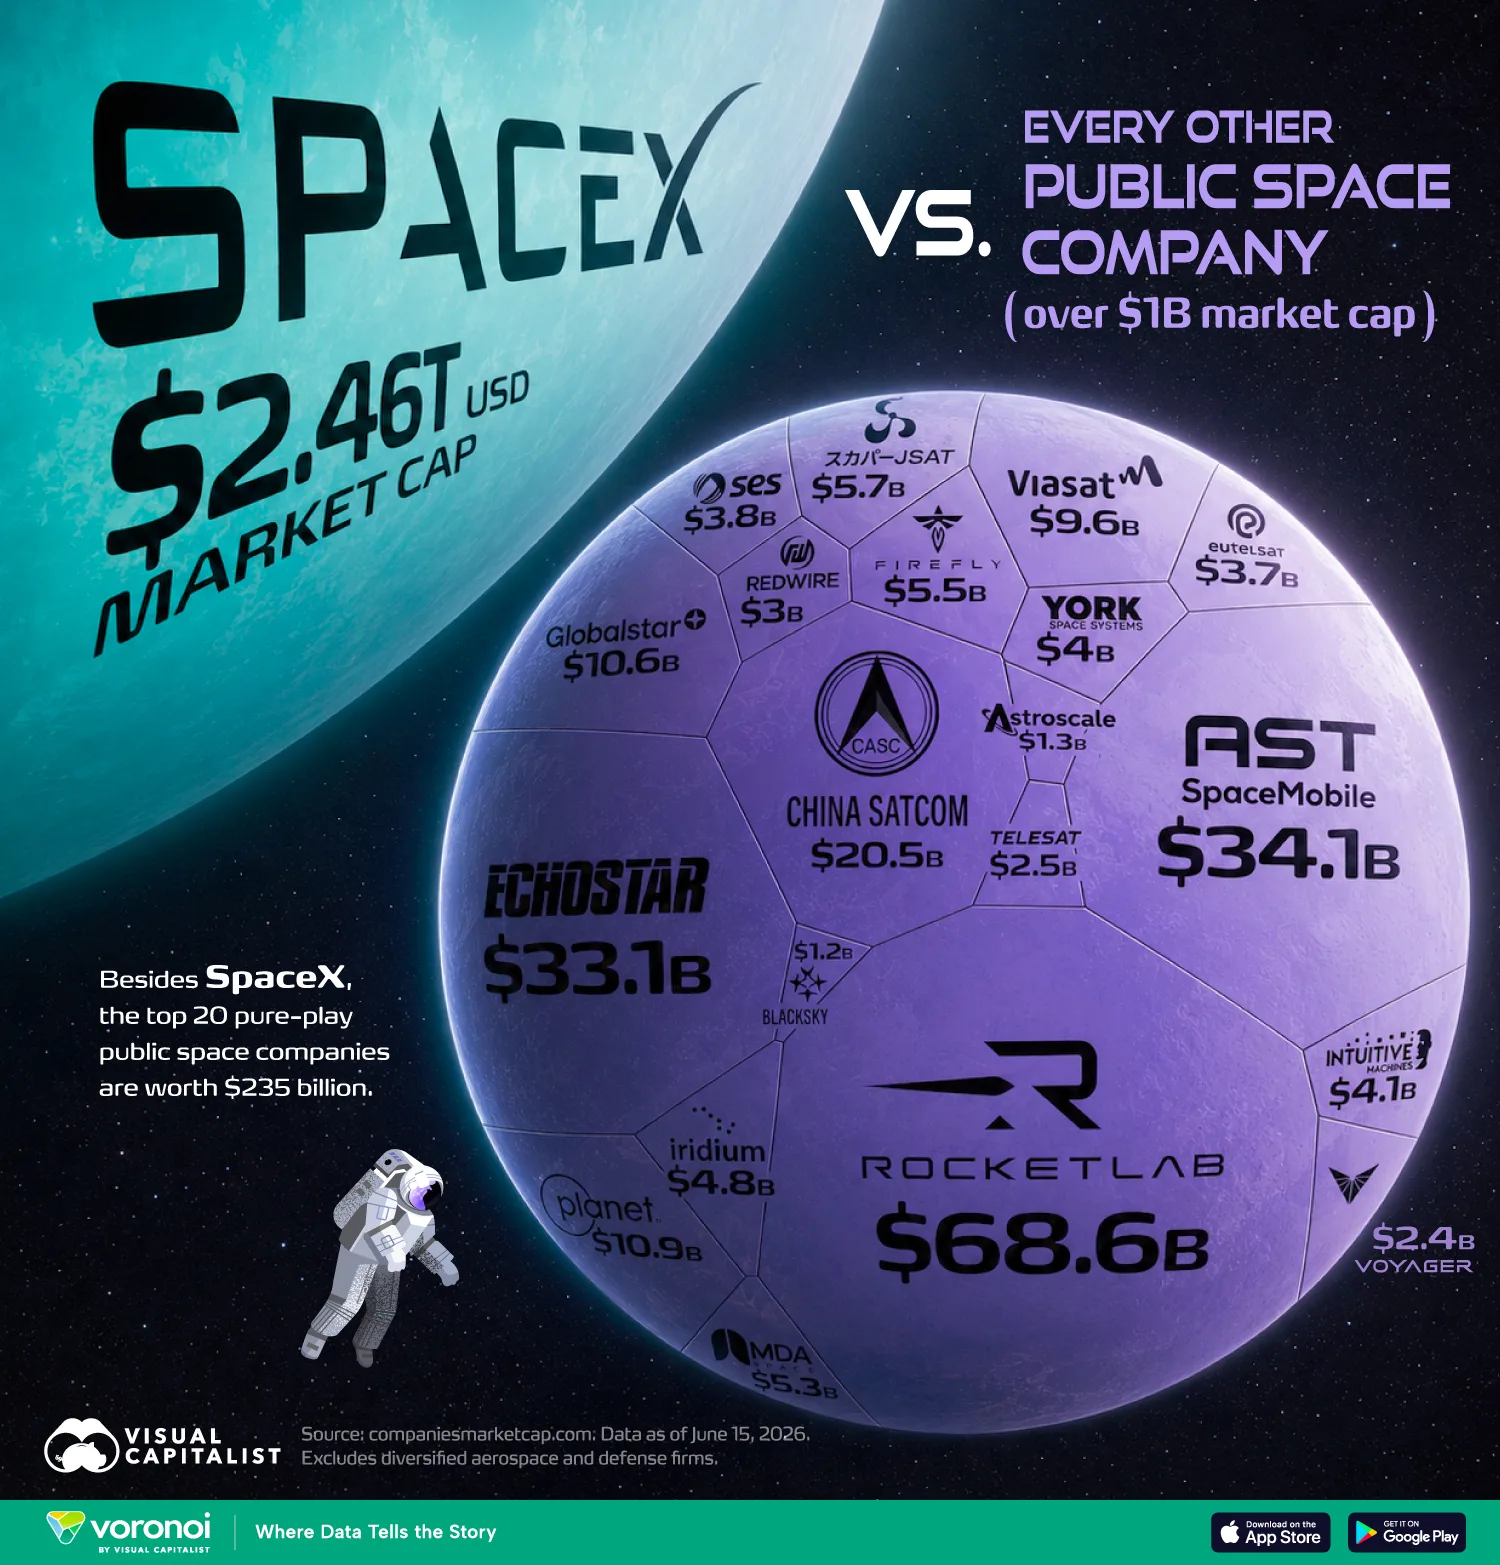
Source: Visual Capitalist
Sources
Alpine Macro, Anchor, Bloomberg, BNY Mellon, Charlie Bilello, Compound Advisors, Edmond De Rothschild, ETFMG, FactSet, Haver Analytics, JP Morgan, Julius Baer, LSEG, Morningstar, Morgan Stanley, Refinitive, RMB, Statista, Sygnia, Strategas, The Intelligent Investor, UBS.
Disclaimer
VEGA Asset Management has taken care that all information provided in this document is true and correct. VEGA Asset Management does not accept responsibility for any claim, liability, loss, expense, or damage. Any information herein is not intended nor does it constitute financial, tax, legal, investment, or other advice. VEGA Asset Management is an authorised Financial Service Provider with FSP number 776. Past performance is not necessarily an indication of future performance.