August 2026 Newsletter
The August 2026 VEGA Newsletter examines volatility across AI hardware investments, recent developments in global and South African markets, and the latest VEGA Global Strategic Fund activity. This edition also features an investment analysis of Richemont and explores the long-term power of compounding.
Categories:
Date Posted:
August 17, 2026
Highlights of this month’s newsletter:
““When you talk, you are only repeating what you already know. But if you listen, you may learn something new.”
― Dalai Lama
Market overview: performance figures (%)
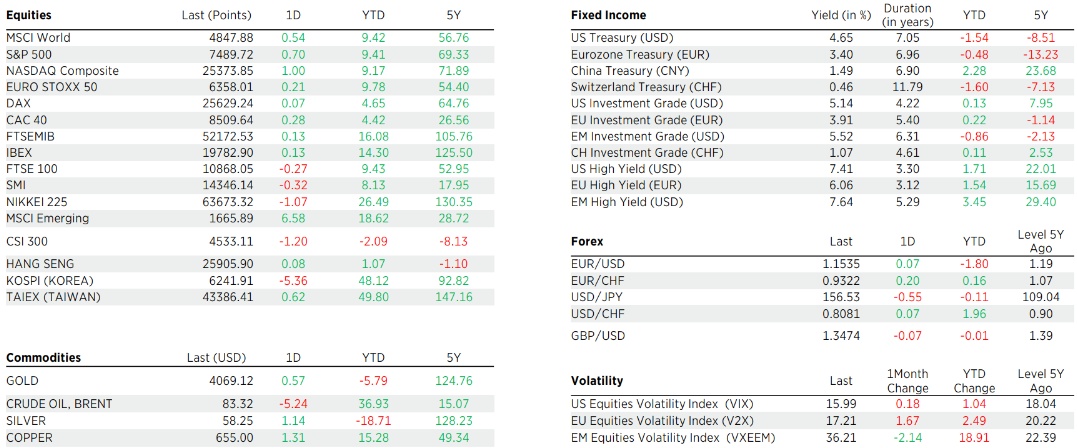
Source: Edmond de Rothschild, 31.07.2026
International market overview
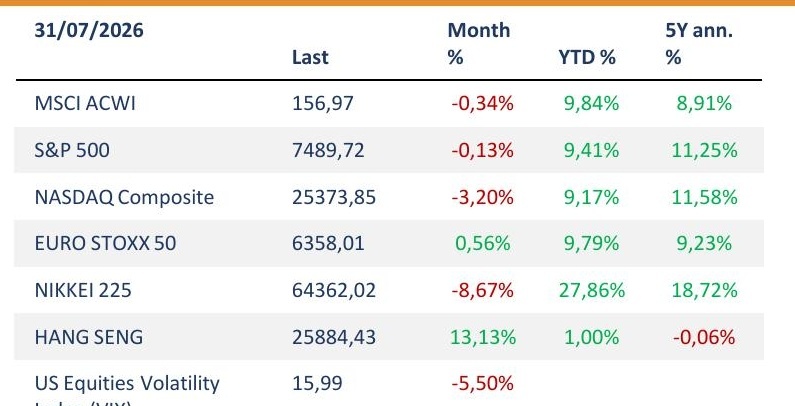
Source: Edmond de Rothschild
AI Hardware Volatility
The AI hardware trade, the primary driver of July 2026 returns, experienced extreme volatility during the month. Micron’s share price fell close to 40% from its June highs, then jumped 18% in a single day on 29 July, before losing 6% on 31 July. Most AI hardware names followed a similar pattern. Four factors help explain the scale of these swings.
1 – Leverage and overconfidence
South Korea’s KOSPI went through a boom-bust cycle in 2026. AI-driven optimism around semiconductor names such as Samsung Electronics and SK Hynix pushed the index above 8,800 points in early June, with market capitalisation doubling in around five months. Retail investors piled into margin loans and leveraged ETFs, some offering up to 5x leverage, pushing margin loan balances to a record 38.63 trillion won ($26 billion) by 24 June, while total investor debt exceeded 60 trillion won ($40.5 billion) by end-May.
When the rally reversed – hit by fading AI enthusiasm, debate over the semiconductor cycle peaking, and renewed Middle East tensions – the KOSPI fell 25% from its June peak by 16 July, briefly entering bear-market territory. The falling market triggered mass margin calls: by 13 July, over 1.2 million leveraged accounts had received margin calls, with 320,000–360,000 forcibly liquidated, wiping out principal and in some cases leaving investors owing their brokers money. One 24-year-old who turned 20 million won into a 15-fold gain using a 500% margin loan lost nearly 300 million won in four weeks. Regulators responded by halting new leveraged ETF listings and raising minimum deposit requirements from 10 million won to 30 million won.
Leopold Aschenbrenner’s AI-focused hedge fund, Situational Awareness, told a similar story. The fund peaked at $45 billion in assets after gaining 439%, then collapsed in July after margin calls from its prime brokers forced a distressed sale of its public holdings to Ken Griffin’s Citadel, cutting assets to roughly $10 billion. Losses stemmed from bullish AI infrastructure bets and bearish software bets that both moved against the fund. Running at roughly 4x leverage meant a modest drawdown could – and did – wipe out most of its capital.
2 – CXMT’s Listing – a “DeepSeek moment” for memory Chips
The Shanghai listing of Chinese memory maker CXMT acted as a psychological catalyst that repriced the entire AI memory trade, even though the competitive threat it poses is still years away. Ahead of its 27 July debut, CXMT’s announced $8.6 billion IPO had already sent Micron down 5% and SK Hynix and SanDisk down 7% on oversupply fears.
When CXMT listed, shares surged nearly 466% on debut, making it mainland China’s most valuable listed company at roughly $540 billion. The reaction across memory names was immediate: SanDisk fell 12%, Micron 5%, SK Hynix 8%, and Western Digital 7%. Reports that Apple was testing CXMT chips adding to fears that Chinese memory could reach top-tier customers. The rout spread directly to Korea, where the KOSPI fell 10.8% in its worst single-day decline in around five months.
3 – Hyperscaler capex and cash flow
Concerns about AI infrastructure funding also weighed on sentiment in July. Several hyperscalers indicated they intend to spend even more than expected on AI infrastructure, even as cash flows turn negative. Having historically self-funded the AI buildout from strong operating cash flow, these companies will now need to turn increasingly to the bond market to fund the additional capital expenditure.
4 – The market usually overreacts
As ever, investors acted irrationally to some of the news flow during the month.
Earnings Highlights
Alphabet
Alphabet’s Q2 results were strong: revenue grew 24% to $120 billion, with operating margin expanding to 34%. Google Cloud grew 82% to $25 billion, with segment margins up to 36%.
This confirms real progress on AI monetisation. Cloud backlog rose to $514 billion from $108 billion a year ago, Search grew 17%, and AI Mode now has over one billion monthly users. We maintain our $433 fair value estimate for wide-moat Alphabet and continue to view it as a way to gain AI exposure across chips, infrastructure, models, and applications without being tied to one part of the stack.
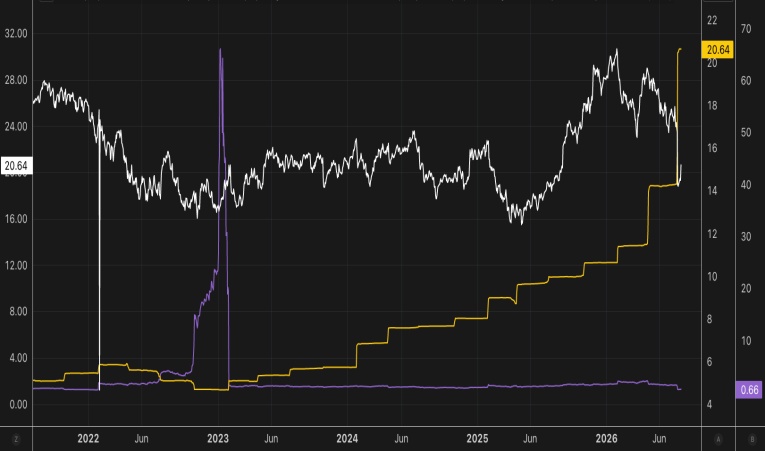
Shares traded down after hours on concerns over capital expenditure, guided to exceed $200 billion in 2026, and free cash flow turned negative this quarter. We would focus on the demand story underpinning that spend rather than the capital expenditure figure itself. Alphabet is now trading at a forward price-to-earnings multiple of around 20 and a PEG (price-to-earnings/growth) ratio of 0.6. Alphabet remains one of our top picks.
Chart 1: Alphabet valuation – forward PE (white line), earnings per share (yellow line) and PEG ratio (purple line)
Source: LSEG
Microsoft
Microsoft’s Q4 results beat the high end of guidance, and shares jumped 16% on the print. Revenue rose 17% year-over-year in constant currency to $90.0 billion (guidance high end: $87.8 billion), with operating margin of 45% versus a guided high end of 44.7%.
Azure strength, across both traditional and AI workloads, pulled through the rest of the business. Commercial bookings grew 18% year-over-year in constant currency excluding OpenAI, and remaining performance obligation rose 84% to $678 billion, roughly 30% recognisable within 12 months. Azure grew 43% in constant currency versus 39.5% guided, while capex grew 110%.
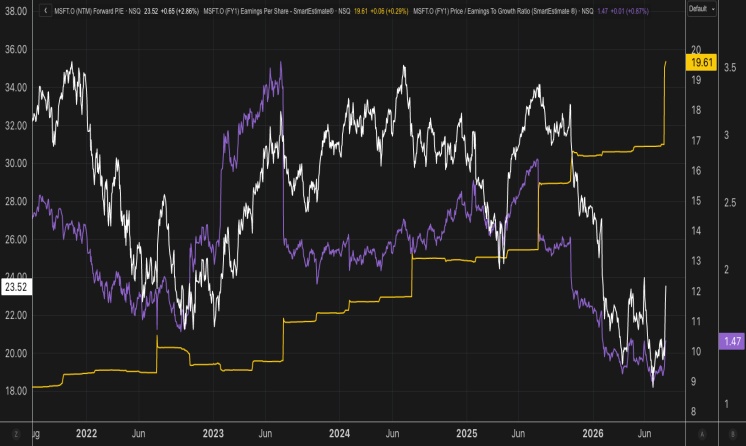
We maintain our buy rating for wide-moat Microsoft, raising our growth forecast but offsetting it with a margin reduction from higher Azure capex. It remains one of our top picks. Guidance for next quarter is slightly ahead of consensus: $90.4 billion revenue, 48.5% implied operating margin, $4.70 implied earnings per share, and $50 billion of capital expenditure. Microsoft’s valuation remains attractive relative to both its competitors and its own historical levels.
Chart 2: Microsoft valuation – forward PE (white line), earnings per share (yellow line) and PEG ratio (purple line)
Source: LSEG
Micron
Micron’s May-quarter results were exceptional, beating revenue and earnings guidance by 24% and 31% respectively. Revenue rose 346% year-over-year to $41 billion, non-GAAP gross margin rose to 85% (from 39% a year ago), and guidance implies further growth and margin expansion.
The AI-driven memory pricing upswing is flattering results, but the key question is the timing and depth of the eventual downcycle. We still expect pricing pressure from new capacity from 2028, though our peak expectations have risen materially. Bulls argue high prices are now structural on the back of parabolic AI infrastructure demand and long-term supply agreements. We see it as a supply/demand question that narrows by 2028, and we don’t view these agreements as fully protective in a downturn.
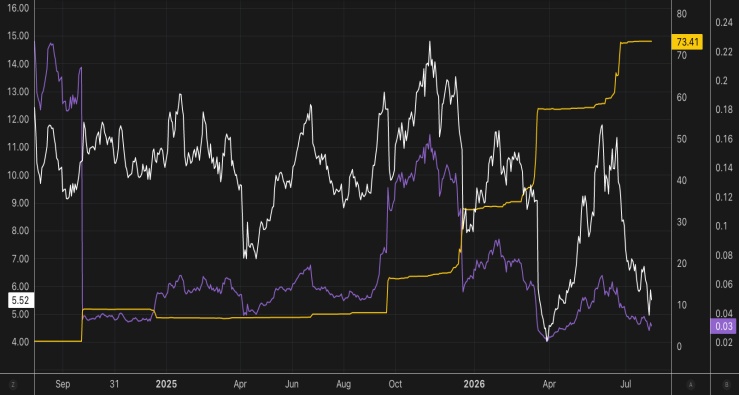
We maintain our buy rating on Micron. We still expect a downturn in 2029, though we expect prices to settle above pre-AI levels given demand continuing to outpace supply longer-term. This is not a call against AI demand, simply a view that a glut of new supply arriving over a short period will pull prices back down, as memory chips ultimately trade like commodities. Valuations are also encouraging, with the forward price-to-earnings multiple below 6. The scale of earnings growth already priced in is worth noting, but we still see a decent margin of safety in the valuation.
Chart 3: Micron valuation – forward PE (white line), earnings per share (yellow line) and PEG ratio (purple line)
Source: LSEG
BlackRock
BlackRock ended June 2026 with record AUM of $15.345 trillion, up 10.4% sequentially and 22.5% year-over-year, driven by strong ETF flows and broad equity market gains.
Net inflows of $199 billion in the second quarter represented 6.2% annualised organic growth. The iShares platform remains the main driver, adding $178 billion in net long-term inflows (13.0% annualised organic growth).
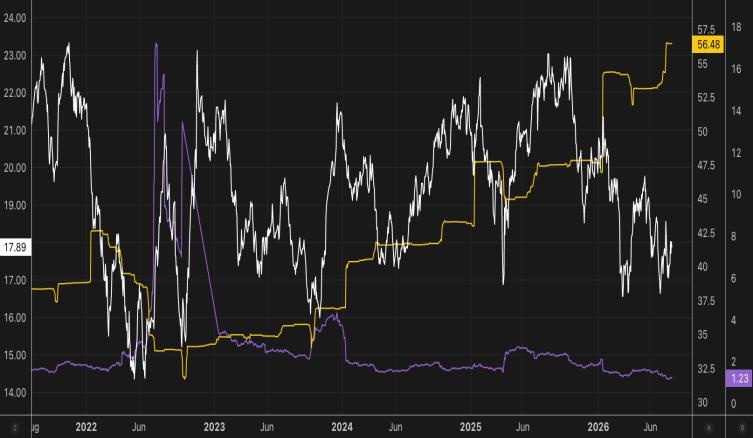
Following a difficult first quarter, marked by the start of the Iran war, the 15% rise in US equities and strong ETF flows delivered the improvement we expected. The forward price-to-earnings ratio is 18, in line with its five-year average. We view BlackRock as slightly undervalued given the quality of the company, the shares remain on our buy list.
Chart 4: BlackRock valuation – forward PE (white line), earnings per share (yellow line) and PEG ratio (purple line)
Source: LSEG
Summary
July was a reminder that the AI trade can move violently in both directions without the underlying fundamentals changing nearly as fast. The KOSPI unwind, the collapse of Situational Awareness, and the CXMT-driven memory scare all shared the same root cause – leverage and crowded positioning, not a break in the AI demand story.
That combination – real, improving fundamentals alongside a market prone to sharp, leverage-driven swings – is precisely why we stay diversified rather than concentrated in the theme, however strong the results. We remain constructive and invested in AI, but spread across other sectors too. Conditions can change quickly, and it’s the overextended and over-leveraged positions that get caught out when they do.
South African market overview
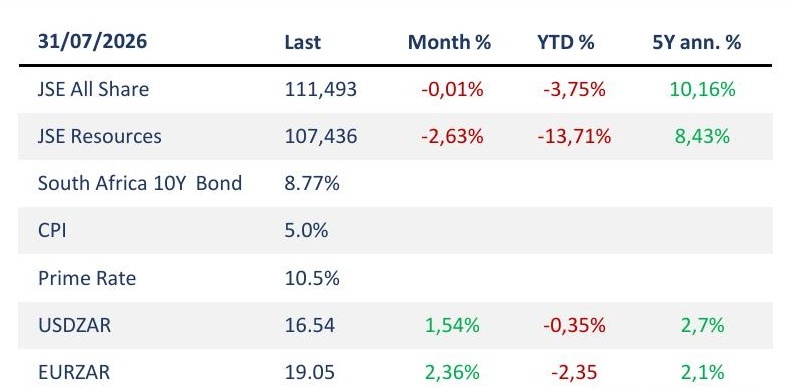
Source: Moneyweb, SARB
SARB decision: surprise hold at 7%
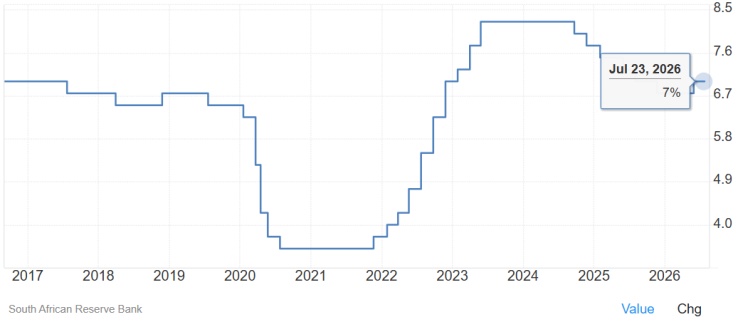
After May’s pre-emptive 25bp hike, the MPC left the repo rate unchanged at 7.00% on 23 July, keeping prime at 10.50%. The vote was four to two, with two members pushing for another 25bp. The decision wrong-footed part of the market, with Nedbank among the houses that had expected a 25bp hike. Kganyago argued policy is already restrictive enough to pull inflation back into the 3% +/- 1 target band next year, and the Bank cut its 2026 inflation forecast to 4.0% while nudging growth up to 1.4%. He cautioned that renewed Middle East conflict, and the oil and fertiliser prices it has lifted, could still force further tightening if it feeds into food and core inflation.
Chart 5: South African Interest Rate
Source: Trading Economics
Inflation at a two-year high
Headline CPI accelerated to 5.0% in June from 4.5% in May, the highest print since June 2024, and above what economists had pencilled in. Transport did the damage, rising 12.7% year on year as fuel prices climbed 34.3% over twelve months with diesel up 50.8% and petrol up 31.7%. The pass-through is now visible: passenger transport rose 8.1% in the month alone, with minibus taxi fares up 11.5%. Core inflation also lifted, a fourth consecutive monthly increase from February’s 3.0% low. Food inflation, at least, continued to cool.
Gold unwinds: the JSE gives back its leadership
The precious metals complex that drove the JSE’s extraordinary 2025 and early-2026 run has gone into reverse. Gold traded near $4,100/oz in July, still roughly 22% above a year ago but more than 25% below the record above $5,500 set in January. Operating leverage cuts both ways, and the miners have been punished disproportionately: AngloGold Ashanti has fallen close to 40% from its 2026 high, with Gold Fields, Kinross and Newmont also well off their peaks, while a more hawkish Fed and 30-year US Treasury yields above 4.9% have removed a key support. The All Share, which peaked in March, has since traded near 110,000, a reminder of how concentrated that leadership was.
SA bonds: the hold unsettles the curve
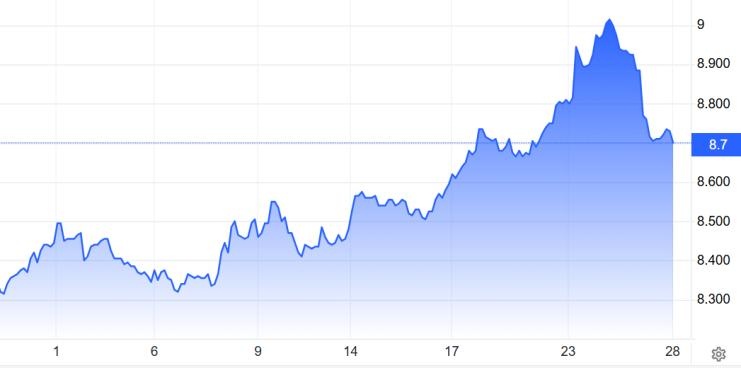
The 10-year yield climbed to 8.85% ahead of the MPC on stronger-than-expected inflation, then pushed toward 8.90% after the hold, the highest since 19 May, before easing to 8.77% by 27 July, some 36bp higher over the month from 8.41% at the end of June. The rand took the sharper blow. It weakened more than 2% on decision day to breach R16.80/$, leaving it among the session’s weakest currencies, and USD/ZAR vaulted its 200-day moving average for the first time since early April in a three-standard-deviation move. September’s meeting is live again; consensus still expects a small hike.
Chart 6: SA 10y Bond Yields (1 Month)
Source: Trading Economics
Fuel: July relief, an August split verdict
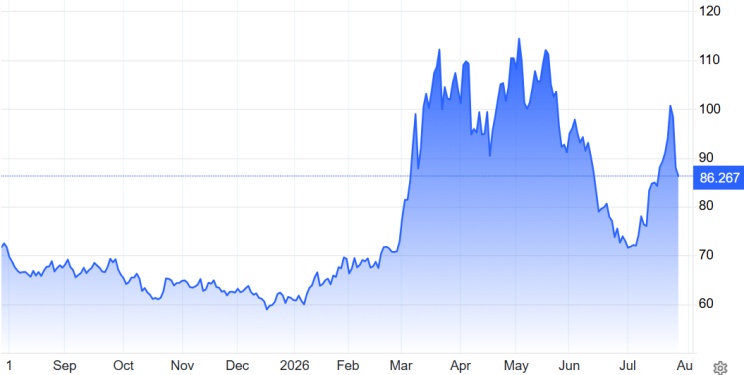
July delivered the cut motorists had waited for, taking inland 95 to R26.10 from June’s record. The reprieve proved fragile: the ceasefire between the US and Iran collapsed on 7 July and Brent climbed from around $72 to roughly $88 by 17 July, vaulting past $100 on 23 July after tankers were reportedly struck off Saudi Arabia. It closed July up almost 24%, then fell to $83.82 on 3 August after Washington shelved a planned strike and reopened talks with Tehran. The official August verdict, effective 5 August, is split: both petrol grades come down 52c/litre, while 500ppm diesel rises R1.38 and 50ppm R1.23. Petrol was rescued by the slate levy, cut from 113.94 to 61.38c/litre. Fleets, not motorists, carry this one.
Chart 7: Brent Crude price in the last 12 months
Source: Trading Economics
Insolvency data returns to the picture
Stats SA resumed publishing insolvency statistics on 21 July, the first standalone release since a 2021 cyberattack disrupted access to the records. The picture is better than the mood suggests. There were 753 insolvencies in the first half of 2026, down 11.1% on the same period last year, with 61 recorded in June against 139 in June 2025, a 56.1% fall, and second-quarter insolvencies 27.3% lower year on year. Gauteng drove most of the improvement. Note the series breaks between September 2021 and December 2022, so long-run comparisons need care.
VEGA Global Strategic Fund Update
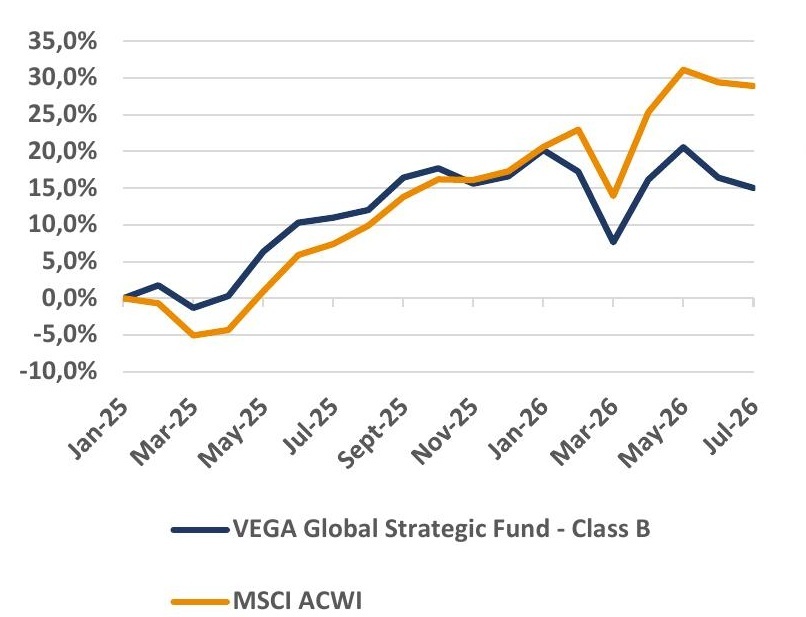
July extended the pullback, with the VEGA Global Strategic Fund declining 1.2% over the month while the MSCI All Country World Index, our reference benchmark, eased a more contained 1.0% in USD terms. Two consecutive negative months have left the fund 1.6% lower year to date, against the benchmark’s 9.6%. We remain confident that the quality businesses we hold will continue to compound as conditions normalise.
Chart 8: Total return in USD since inception
Portfolio strategy
In the wake of heightened market volatility following President Trump’s tariff announcements, our stance has been to remain disciplined and avoid reactive portfolio shifts. History consistently shows that impulsive responses to short-term political noise often result in suboptimal investment outcomes.
Instead, we have used this environment to evaluate high-quality businesses that were indiscriminately sold off despite their strong long-term fundamentals. Periods of uncertainty can create attractive entry points into quality companies at compelling valuations, and we continue to focus on identifying these opportunities with a long-term perspective.
The portfolio remains invested in leading global businesses with durable competitive advantages, particularly those delivering high returns on capital and robust free cash flow generation. Dividend policies are not a central consideration in our selection process, as we generally favor companies that reinvest earnings to drive future growth.
We also resist the temptation to follow short-lived market trends or fashionable investment narratives, as preserving portfolio quality takes precedence over chasing momentum.
Changes during the Month:
Added Position – Chevron (CVX)
We added Chevron as a hedge for the Middle East conflict as well as to introduce a cash-generative energy holding into a portfolio otherwise heavily levered to the technology sector. Energy has been one of the year’s stronger sectors precisely because its earnings do not depend on artificial intelligence delivering a return on capital. The Hess assets and Permian and Guyana growth have lifted production, while management has capped capital spending, so the dividend and buyback stay funded even at materially lower oil prices.
Added Position – Alibaba (BABA)
We added Alibaba to gain exposure to the artificial intelligence build-out at a valuation the American hyperscalers no longer offer. Its cloud division is compounding quickly, growth from external customers is accelerating, and demand for AI products remains exceptionally strong. Uniquely among Chinese peers, the group designs and produces its own accelerators at scale, which should protect margins as it grows.
Removed Position – Meta (META)
We removed Meta because its spending on artificial intelligence has begun to overwhelm its cash generation. Capital expenditure now absorbs almost all of the cash the business produces, free cash flow has all but disappeared, and margins have narrowed as guidance rose again. Unlike its peers, the group has no established cloud business through which to monetise what it is building.
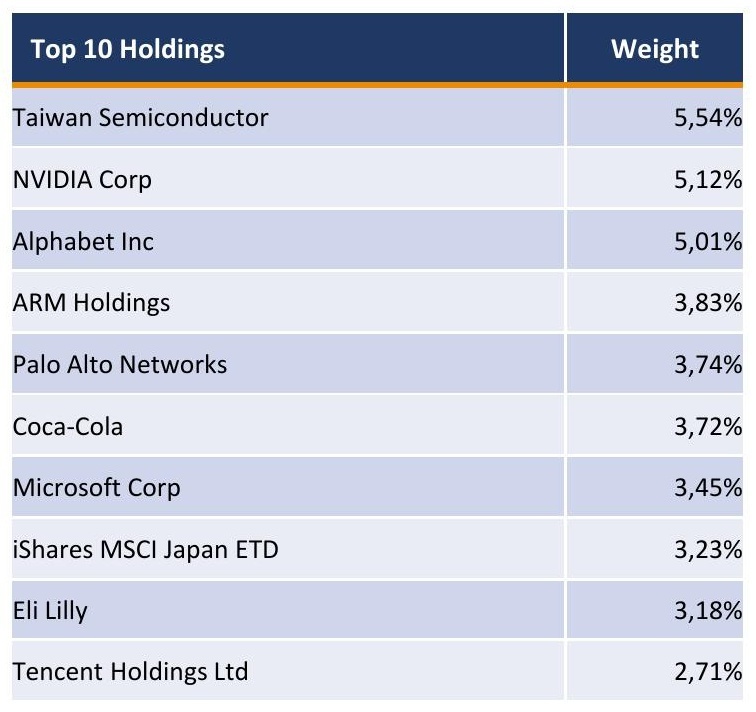
Top 10 Holdings
Monthly returns in USD net of fees

Share of the month: Compagnie Financière Richemont SA (CFR)
Investment Case | Wide Moat | Standard Capital Allocation | Fair Value: CHF 186/share

Business Strategy & Outlook
Richemont is the world’s number-two luxury goods group by revenue, with a portfolio of century-old brands concentrated in hard luxury: jewellery and specialist watchmaking. Anchored by Cartier and Van Cleef & Arpels, the Jewellery Maisons combine iconic collections, decades-long product cycles and significant pricing power.
Hard luxury benefits from longer product cycles and lower fashion risk than leather goods or apparel. Watches are priced above EUR 5,000 and the prestige attached to them insulate the business from technological disruption, while high entry barriers and tight distribution control underpin durable economic profits despite industry cyclicality.
First-quarter FY27 sales rose 20% at constant currency, accelerating from 13% in Q4, with Jewellery Maisons up 24%. Asia-Pacific ex-Japan grew 21% and the Chinese cluster returned to +9% — an encouraging signal for a recovery led by affluent rather than aspirational consumers. We expect 6-7% long-term revenue growth, above the 4-5% industry rate.
At recent levels the shares trade at roughly a 4% premium to our CHF 186 fair value estimate, leaving little margin of safety despite the quality of the franchise.
Economic Moat
We assign Richemont a wide economic moat based on intangible assets, assessed across pricing power, conspicuous consumption, investment value and distribution control. The group scores strongly on most, with watches slightly weaker on distribution than jewellery.
- Pricing power: watches priced above EUR 5,000 and jewellery operating margins in the low-to-mid 30% (vs ~20% for Bulgari).
- Conspicuous value: iconic shapes and gifting culture (up to 70% of demand in top markets); Cartier has been a top-10 gifting brand for Chinese HNW individuals since 2013.
- Investment value: collections lasting 40-80 years hold value well; Cartier and Van Cleef signatures can add 50-100% to auction prices.
- Distribution control: jewellery direct-to-consumer at 82%; watch retail share up to 60%, from 40% pre-pandemic.
- Category leadership: Cartier and Van Cleef are the largest and most profitable brands in a segment shifting from unbranded to branded.
Financial Strength
Richemont’s balance sheet is exceptionally strong, with net cash of EUR 8.4 billion as of March 2026. Free cash flow has been robust for a decade and should benefit from moderating capital expenditure as manufacturing and retail expansion rolls over; capex should normalise around 5% of sales.
We forecast 6-7% revenue growth over the next 10 years, with Jewellery Maisons compounding closer to 8%. Growth in Specialist Watchmakers and Other divisions is expected to be slower given less established brand positions.
Group operating margin should expand from around 20% in FY26 to 28% over the decade, helped by better capacity utilisation, mix shift toward Jewellery Maisons, cost discipline in watchmaking and a modest pricing tailwind.
Capital Allocation
We assign Richemont a Standard Capital Allocation rating, reflecting a very sound balance sheet, a fair investment record, and shareholder distributions that we view as somewhat low given the cash on hand.
The group is controlled by Johann Rupert, who holds 10% of capital and 51% of voting rights as executive chair. The dual-class structure is not ideal for minorities, but there is no opt-out clause and we believe his interests are well aligned with long-term investors.
Nicolas Bos, previously CEO of Van Cleef & Arpels, became group CEO in 2024 and all division heads now report to him. The long-term record is solid — most watch brands and Van Cleef were acquired below fair value — with Yoox Net-a-Porter a notable miss, since divested.
Key Risks
- China and emerging markets: slower wealth creation would weigh on demand; the Chinese cluster is critical to the sector’s recovery.
- Currency mismatch: costs are largely in Swiss francs while sales are in euros and USD-linked currencies, and price transparency makes offsetting FX moves through pricing harder.
- Growth-exclusivity tension: at the very high end, Richemont must manage brand exclusivity as it grows, particularly in Jewellery Maisons.
- Watch cyclicality and raw materials: specialist watchmaking is more cyclical than jewellery, and rising gold prices can compress margins near term.
Source: Morningstar
Same as Ever – Chapter 12: Tiny and Magnificent
Morgan Housel opens with a truth that overturns our instinct to match the size of an effect to the size of its cause: Some of the most magnificent outcomes in history have been set in motion by something almost imperceptibly small. We assume that enormous results must have enormous origins, and that great change requires great force. Housel argues the opposite is frequently true. Tiny things, given the right conditions and enough time, can produce results so vast that they reshape entire landscapes, industries, and fortunes.
His central illustration comes from the science of ice ages. For a long time it was assumed that these were caused by brutally cold winters. The reality, turned out to be far more subtle. Ice ages are not driven by cold winters at all, but by mild summers. When a summer is cool enough that the previous winter’s snow does not fully melt, that lingering snow reflects sunlight, which cools the surface further, which allows still more snow to survive the following year. A minuscule change in the amount of summer sunlight, caused by a slight wobble in the Earth’s orbit, is enough to trigger a cycle that eventually buries whole continents beneath sheets of ice.
The lesson is about the mechanics of compounding. The ice sheet does not appear because of one dramatic event. It appears because a small advantage repeats, feeds on itself, and accumulates quietly over an unfathomable stretch of time. The same principle governs the growth of forests from single seeds, the spread of ideas from a single conversation, and, most relevant to us, the accumulation of wealth from modest and unremarkable beginnings. What looks magnificent at the end was very often tiny at the start.
The Psychology Behind It
The trouble is that human beings are poorly suited to appreciating this. We are drawn to dramatic explanations for dramatic outcomes because they satisfy a deep need for the story to feel proportionate. A vast fortune ought to have a brilliant, decisive moment behind it. A great catastrophe ought to have an equally great cause. When the true explanation turns out to be something small and slow, it can feel almost disappointing, and so we overlook it in favour of something more exciting. There is also a genuine cognitive difficulty at work. We think in straight lines, expecting that a small input will produce a correspondingly small output. Compounding does not behave this way. It produces results that are modest and easy to ignore for a very long time, and then, seemingly all at once, they become extraordinary. Because the early stages are so unremarkable, we routinely underestimate where they might lead, and we abandon promising processes long before they have had the chance to reveal their power.
This has a further consequence for how we behave. Because small things feel insignificant in the moment, we tend to neglect them and search instead for the single, transformative action that will change everything at once. We chase the dramatic decision while ignoring the quiet, repeated habits that actually determine the result. Yet it is almost always the accumulation of small, consistent actions, rather than any one grand gesture, that separates a magnificent outcome from an ordinary one.
What This Means for Investors
For investors, Chapter 12 is really a meditation on the most important force in finance, which is compounding. The returns that transform a portfolio over a lifetime are rarely the product of a single spectacular decision. They are the product of a reasonable rate of return sustained, without interruption, over a very long period. The size of the eventual outcome is almost entirely a function of how small the interruptions were and how long the process was allowed to run. Modest, patient, and consistent almost always defeats brilliant but erratic. It is encouraging because it means one does not need to be exceptional, or to make heroic calls, in order to achieve a magnificent result over time. It is demanding because it requires patience with a process that will, for long stretches, feel far too slow to be worth the effort.
Graph of the month
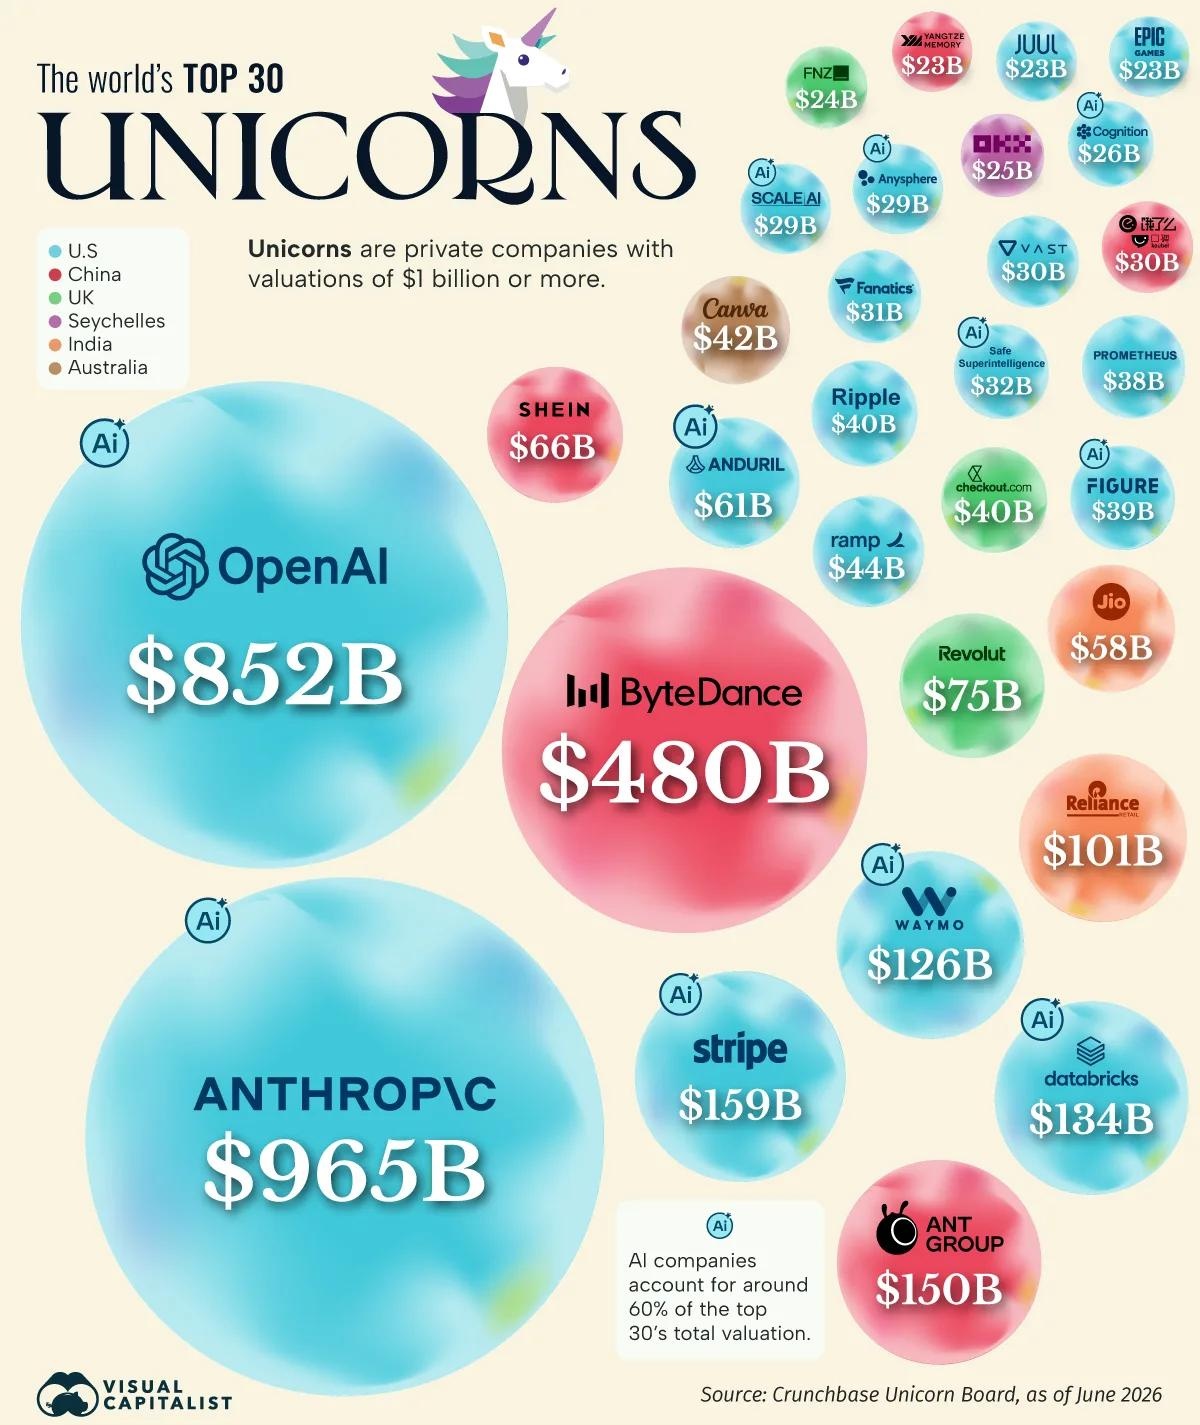
Source: Visual Capitalist
Sources
Alpine Macro, Anchor, Barchart, Bloomberg, BNY Mellon, Business Day, BusinessTech, Central Energy Fund, Charlie Bilello, Citi, CNBC, Compound Advisors, DigitFMS, Edmond De Rothschild, ETFMG, EWN, FactSet, Finimize, FXStreet, Haver Analytics, Investing.com, InvestorIdeas, IOL, JP Morgan, Julius Baer, LSEG, Moneyweb, Morgan Stanley, Morningstar, News24, Refinitiv, Reuters, RMB, SAnews, SARB, Société Générale, Statista, Statistics South Africa, Strategas, Sygnia, The Intelligent Investor, The South African, TimesLIVE, Trading Economics, TreasuryONE, UBS, Vutivi Business, Wise.
Disclaimer
VEGA Asset Management has taken care that all information provided in this document is true and correct. VEGA Asset Management does not accept responsibility for any claim, liability, loss, expense, or damage. Any information herein is not intended nor does it constitute financial, tax, legal, investment, or other advice. VEGA Asset Management is an authorised Financial Service Provider with FSP number 776. Past performance is not necessarily an indication of future performance.