June 2026 Newsletter
June delivered another month of strong market narratives, from surging AI infrastructure investment and NVIDIA's continued dominance to South Africa's surprise interest rate hike and Moody's positive outlook revision. In this edition, we unpack the key developments shaping global and local markets, review the VEGA Global Strategic Fund's performance, and explore Morgan Housel's insights on the power of rare, market-defining events in Chapter 10 of Same as Ever.
Categories:
Date Posted:
June 5, 2026
Highlights of this month’s newsletter:
“I was raised by books. Books, and then my parents.”
― Elon Musk
Market overview: performance figures (%)
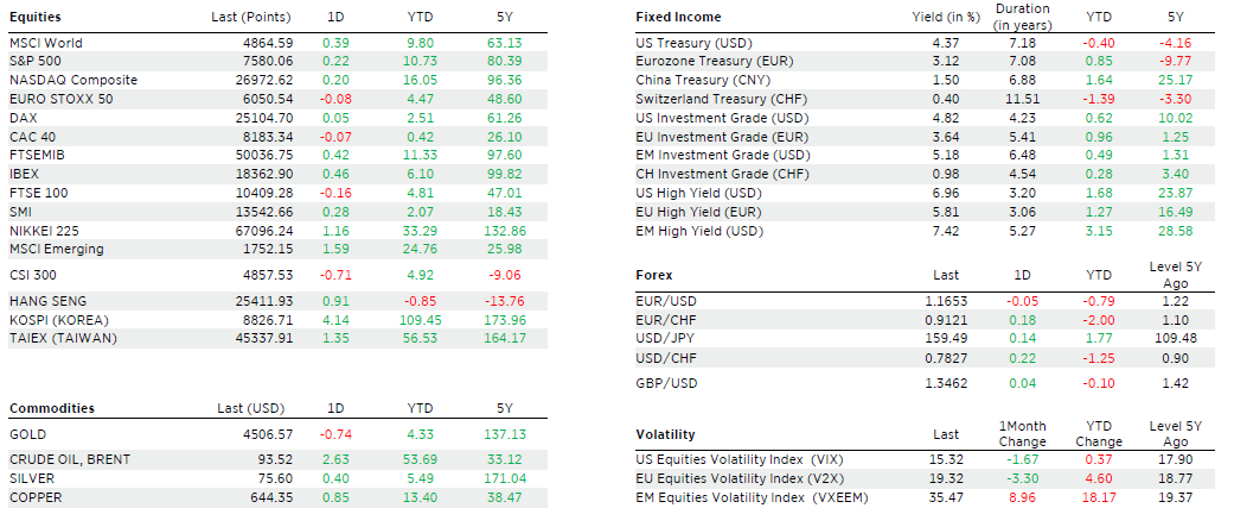
Source: Edmond de Rothschild, 31.05.2026
International market overview
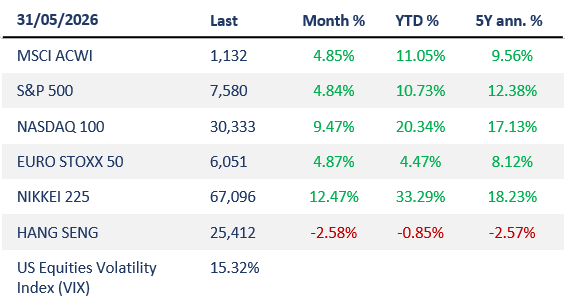
Source: Edmond de Rothschild
The first-quarter earnings season in the U.S. has closed, and the results were impressive. S&P 500 earnings per share rose 29% year over year, more than double the 13% consensus estimate. This is an unprecedented boom, driven by the massive earnings per share gains in big technology on the back of Artificial Intelligence (AI). Expected earnings per share growth for the 2026 calendar year has now increased to 24%.
May brought significant activity across the private markets, headlined by two of the most consequential funding and listing stories in recent memory.
- Anthropic, maker of Claude AI, has officially become one of the world’s most valuable startups after raising $65 billion in Series H funding at a $965 billion valuation, surpassing chief rival OpenAI, currently valued at $852 billion. The raise ups the ante as the two large-language-model makers race toward public listings, both reportedly planning IPOs that could rival SpaceX’s. Anthropic has also prioritised building out computing capacity through strategic partnerships: Amazon is committing up to 5 gigawatts of AWS compute, while Google and Broadcom have agreed to supply 5 gigawatts of TPU chips. The company has additionally signed an agreement to access GPU capacity from SpaceX’s Colossus data centres.
- SpaceX is targeting a $1.75–$2 trillion valuation on listing day, while seeking to raise more than $75 billion. For context, the current IPO fundraising record is Saudi Aramco’s $29 billion raise in 2019. The valuation is demanding. SpaceX posted 2025 revenue of $18 billion versus Amazon at $717 billion. The market cap is roughly $1.75–$2 trillion for SpaceX, compared with around $2.9 trillion for Amazon, implying a price-to-sales ratio of about 110x for SpaceX versus roughly 4x for Amazon.
The memory trade rolls on
The memory-chip trade continued its merry way, with Micron, SK Hynix and Samsung breaking the $1 trillion valuation levels in May. AI data centre demand for memory has skyrocketed, driven by the shift toward inference use cases rather than model training.
Year to date the semiconductor sector outperformed the S&P 500 meaningfully. Graph 1 shows the performance of the semiconductor ETF (82%) versus the S&P 500 (11%). This tells us the current optimism is very much focused on the AI spending boom and not on the strength of the broader global economy. Graph 2 illustrates the amount of AI capital expenditure expected over the next 5 years.
Chart 1: Year to date performance of the S&P 500 (blue line) vs the semiconductor ETF (SOXX) (white line)
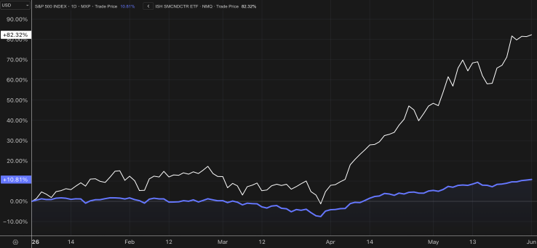
Source: Bloomberg
Chart 2: Baseline aggregate AI capex estimates (billions)
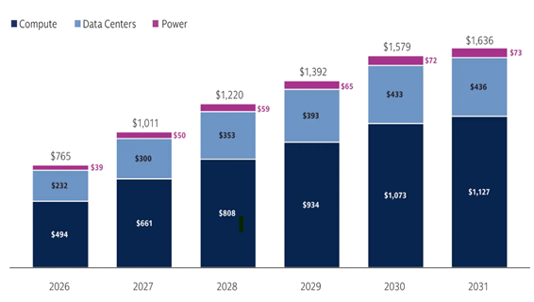
Source: Goldman Sachs
Risks to note
Oil price and inflation – The Fed’s preferred inflation gauge, Core PCE, rose to 3.3% in April, its highest since October 2023. Core PCE has now exceeded the Fed’s target for 62 consecutive months. Elevated energy prices are a key upside risk.
Recession and an unstable world – The Iran war casts a dark shadow over an otherwise modestly positive outlook for the advanced world and many emerging markets. Sky-high energy prices and uncertainty will slow global growth and add to inflation noticeably, especially in energy-importing countries. Should the war rage longer, higher inflation for longer could force central banks toward tighter, or less accommodative, policy, exacerbating the hit to growth.
Trade war risk – Beyond elevated energy prices, higher tariffs could hurt Trump’s Republicans ahead of the U.S. midterm elections in November. We therefore assume that amid the noise Trump will not raise the average U.S. tariff rate significantly this year. Otherwise, the damage to the U.S. and global economy would exceed our forecasts.
Time to cut — or hike? – The ECB will likely hike once in June before realising it need not press on, unless the Iran conflict worsens markedly. The BoE will delay its next rate cut to December. The Fed will stay put, while the BoJ continues to tighten cautiously.
Summary
S&P 500 EPS growth of 24% for 2026 sets a steep bar. Lofty expectations make it harder to beat and earn meaningful share-price gains, leaving real downside risk if results disappoint.
That said, we remain constructive for the following reasons. We do not see AI spend disappointing, we expect Germany to lift defence and infrastructure spending, labour markets are holding up well, and we remain positive on the U.S. economy. We stay optimistic about the rest of 2026, though periods of elevated volatility are likely.
South African market overview
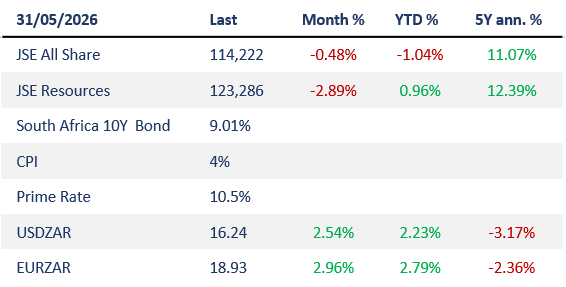
Source: Moneyweb, SARB
SARB hits back: Defensive 25bp hike
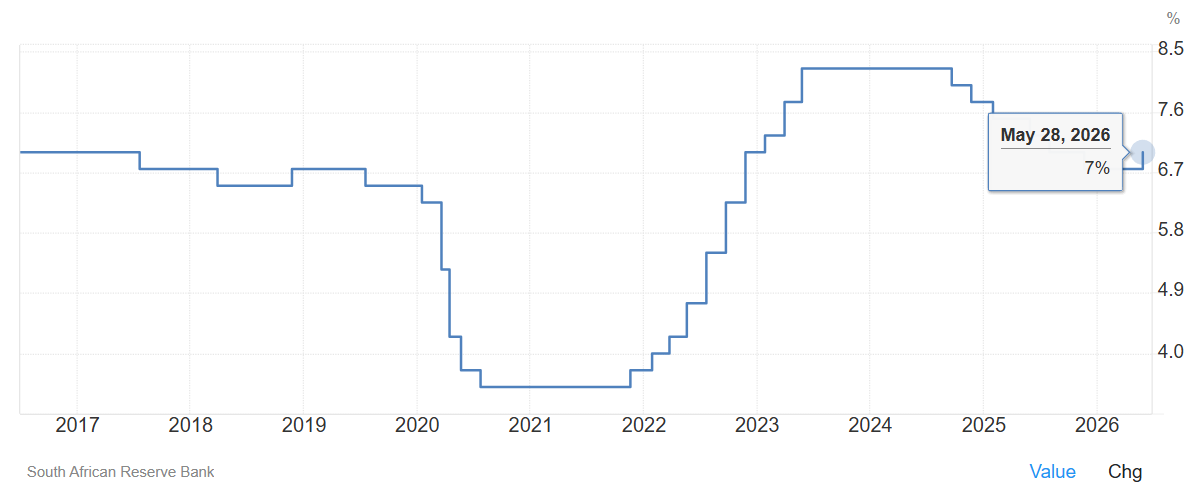
After holding the policy rate at 6.75% for two consecutive meetings, the MPC hiked the rate by 25bp to 7% and lifted prime to 10.50%. The decision is a pre-emptive defence of the new 3% inflation target and the rand, reversing what was a clear easing trajectory only two months ago. Governor Kganyago has emphasised that while the SARB cannot control global oil prices or the initial shocks from Middle East conflicts, the bank remains firmly committed to anchoring inflation near the 3% midpoint target.
Chart 3: South African interest rate
Source: Trading Economics
Moody’s turns positive on SA
Moody’s revised South Africa’s sovereign rating outlook from stable to positive in May, signalling that a rating upgrade from the current Ba2 is more likely than not. The agency pointed to steadfast fiscal consolidation, improving state-owned enterprise finances and growing traction from structural reforms. Bond investors are the main beneficiaries. Lower debt-servicing costs further support the case for additional upgrades down the line. The decision was not widely expected and clearly lifts investor sentiment.
Richemont: Our luxury holding reported resilient returns
Richemont, the JSE-listed luxury group behind Cartier, Van Cleef & Arpels and IWC, delivered a solid set of financial results on 22 May, with sales of €22.4bn (+11% at constant rates) and operating profit of €4.5bn. The Jewellery Maisons remain the engine room, growing 14% with double-digit gains across every region. The Americas led at +17%, while China showed early signs of stabilisation. A stronger euro and a higher gold price were a drag on margins, but the €8.5bn net cash position and proposed 10% dividend hike underline the long-term strength of the franchise.
SA bonds: A tentative recovery
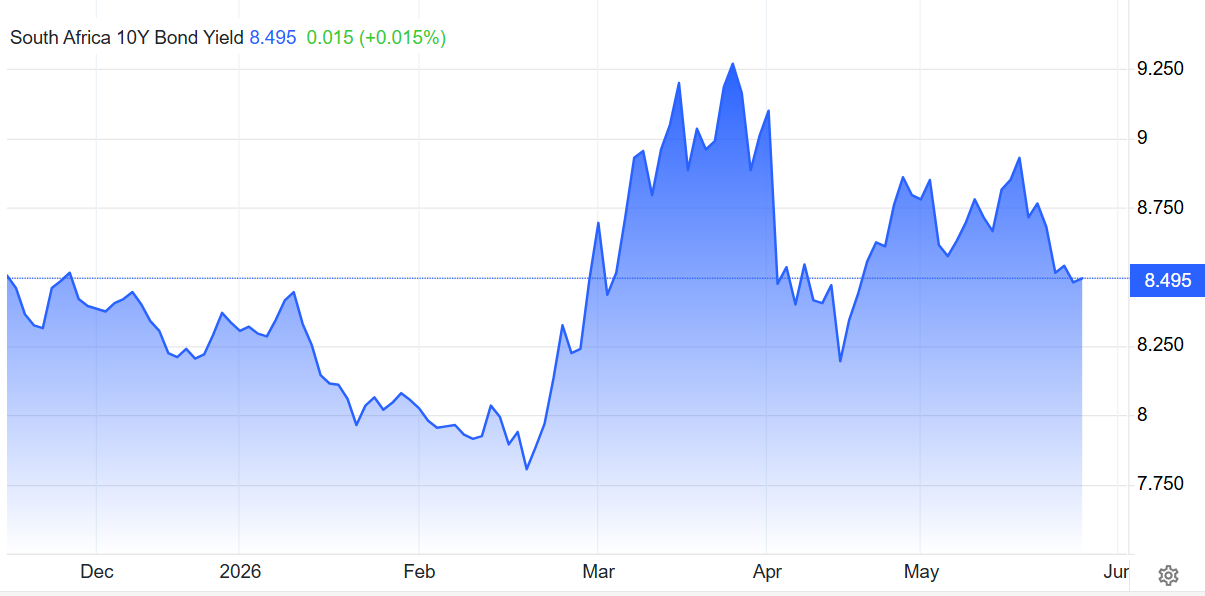
South African government bonds were one of the better stories of the month. The 10-year yield, which had pushed up to 8.85% in early May as markets priced in a prolonged Iran war, fell back to around 8.5% by month-end as ceasefire talks gained traction and Brent crude slid more than 15% from its March peak. That is still well above the sub-8% levels reached in January, but the move lower in May is a meaningful signal that foreign investors are willing to take SA risk again.
Chart 4: SA 10y bond yields
Source: Trading Economics
May fuel shock: A historic price reset
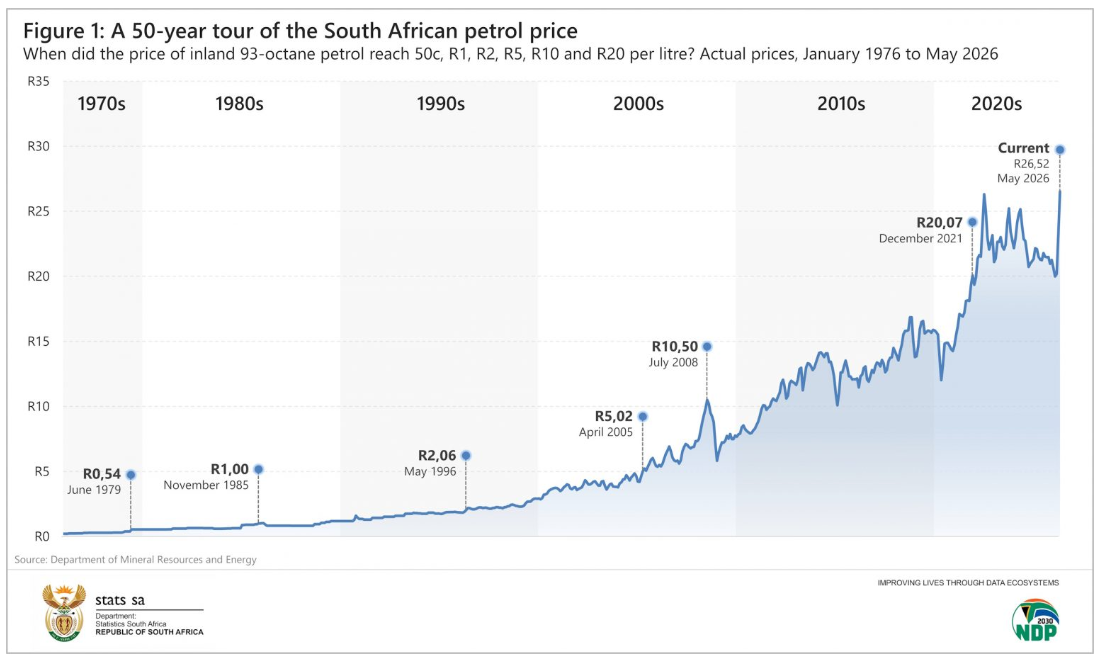
Petrol 93 and 95 rose by R3.27 per litre, while diesel jumped a brutal R5.27/l, taking inland 93 to R26.52, the highest nominal level on record. LPGas rose R5.07/kg in Gauteng and R5.78/kg in the Western Cape. Stats SA confirmed the May print as the highest ever for inland 93-octane and the sixth-largest monthly hike since 1976. The shock weighed on transport, logistics and consumer-facing JSE shares and nudged bond yields higher, though the rand held firm on Iran ceasefire optimism.
Chart 5: Petrol prices over the last 50 years
Source: StatsSA
Online gambling drains SA retail
A quieter but increasingly important story for South African equities is the rapid rise of online gambling. According to the National Gambling Board, total gross gambling revenue reached R75bn in the year to March 2025, up 26%, with online and sports betting alone surging to R49bn, close to a sixfold increase in just four years. Gambling now accounts for roughly a quarter of all household entertainment spending, up from 12% before Covid. For JSE-listed retailers, this helps explain why the long-awaited consumer recovery has been so muted, and why stock selection within the sector matters a lot more.
Source: Anchor Capital
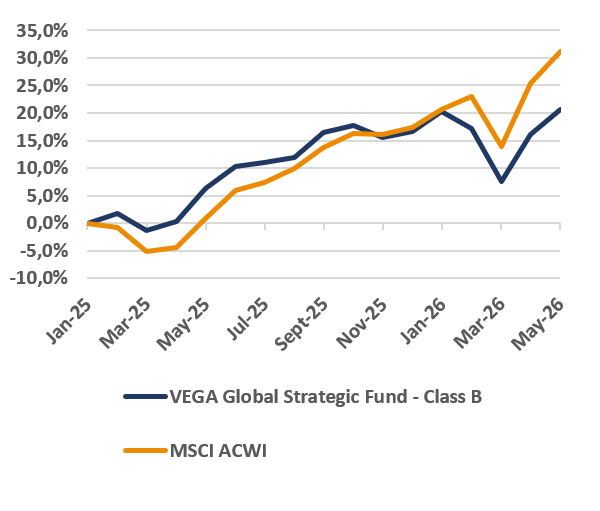
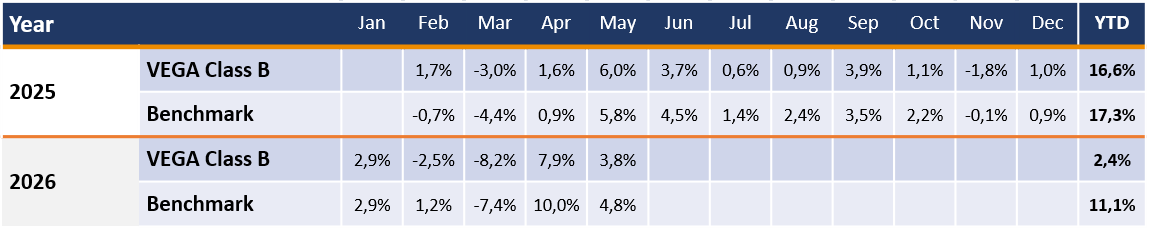
May extended the recovery which started in April, with the VEGA Global Strategic Fund returning 3.8% over the month while the MSCI All Country World Index, our reference benchmark, returned 4.8% in USD terms. After the sharp 10.0% benchmark rebound in April, May settled into a steadier rhythm and the fund kept pace closely on the way up. We remain confident that the quality businesses we hold will continue to compound as conditions normalise.
VEGA Global Strategic Fund Update
May extended the recovery which started in April, with the VEGA Global Strategic Fund returning 3.8% over the month while the MSCI All Country World Index, our reference benchmark, returned 4.8% in USD terms. After the sharp 10.0% benchmark rebound in April, May settled into a steadier rhythm and the fund kept pace closely on the way up. We remain confident that the quality businesses we hold will continue to compound as conditions normalise.
Chart 6: Total return in USD since inception
Portfolio strategy
In the wake of heightened market volatility following President Trump’s tariff announcements, our stance has been to remain disciplined and avoid reactive portfolio shifts. History consistently shows that impulsive responses to short-term political noise often result in suboptimal investment outcomes.
Instead, we have used this environment to evaluate high-quality businesses that were indiscriminately sold off despite their strong long-term fundamentals. Periods of uncertainty can create attractive entry points into quality companies at compelling valuations, and we continue to focus on identifying these opportunities with a long-term perspective.
The portfolio remains invested in leading global businesses with durable competitive advantages, particularly those delivering high returns on capital and robust free cash flow generation. Dividend policies are not a central consideration in our selection process, as we generally favour companies that reinvest earnings to drive future growth.
We also resist the temptation to follow short-lived market trends or fashionable investment narratives, as preserving portfolio quality takes precedence over chasing momentum.
Monthly returns in USD net of fees
Changes which were made during the month
Lumentum Holdings — Added Position
We initiated a position in Lumentum given its critical role as a supplier of optical components and lasers used in AI data centre interconnects. With hyperscaler capital expenditure accelerating and demand for high-speed optical networking outpacing supply, the company is well positioned to benefit from a multi-year investment cycle. We were pleased to establish exposure at a reasonable entry point.
ABB Ltd — Added Position
We initiated a position in ABB given its leadership in electrification, automation and power distribution — areas central to the data centre buildout and global supply chain reshoring. The company offers a high-quality industrial franchise with strong cash generation, a robust order book and clear exposure to several long-term structural growth themes.
JPMorgan Chase & Co. — Added Position
We initiated a position in JPMorgan given its position as the highest-quality franchise in global banking. The company combines a fortress balance sheet, diversified earnings across consumer, corporate and investment banking, and disciplined capital allocation. With elevated interest rates supporting net interest margins, the risk-adjusted return profile looks attractive.
Palantir Technologies — Removed Position
We exited our holding in Palantir following a period of satisfactory performance. While the company remains well positioned in the enterprise AI and government analytics space, valuation levels had become difficult to justify on any reasonable medium-term earnings basis, and the capital was redeployed into opportunities offering greater clarity.
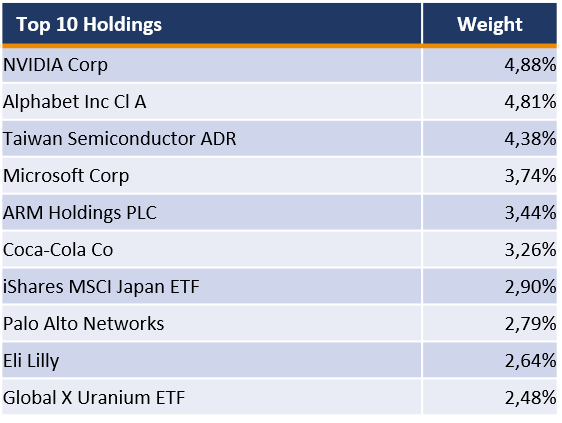
Top 10 Holdings
Share of the month: NVIDIA (NVDA)
Investment Case | Wide Moat | Exemplary Capital Allocation | Share Price: $224/share
Business strategy & outlook
NVIDIA is the foundational hardware and software platform for the global build-out of artificial intelligence. Its graphics processing units, paired with the proprietary CUDA software ecosystem and high-speed networking, sit at the centre of virtually every large-scale AI training cluster being deployed today.
Parallel processing on GPUs has emerged as a near-requirement for AI workloads, and NVIDIA took an early and decisive lead in both the silicon and the developer tools needed to build modern models. CUDA, NVLink, and the firm’s networking stack (InfiniBand and Spectrum Ethernet, anchored by the Mellanox acquisition) collectively allow customers to cluster GPUs into the very large systems required for frontier model training.
The data centre business has scaled from $3 billion in fiscal 2020 to $194 billion in fiscal 2026, and management has guided to $1 trillion in cumulative Blackwell and Rubin revenue over calendar 2025 to 2027. NVIDIA itself foresees $3 trillion to $4 trillion of annual AI infrastructure spending by 2030, and we believe the company is positioned as the principal beneficiary.
Economic moat
We assign NVIDIA a wide economic moat, underpinned by intangible assets in GPU design and meaningful customer switching costs around the CUDA software platform. The combination of leading hardware and proprietary developer tools makes it difficult for AI developers to migrate to alternative chips, even when comparable silicon emerges.
Key moat sources:
- CUDA switching costs: AI models built on CUDA do not port readily to rival GPUs, giving NVIDIA a powerful incumbency advantage even against competitive silicon.
- Hardware leadership: Clear market share leader in discrete GPUs and AI accelerators, with a multi-year cadence from Hopper to Blackwell to Rubin.
- Networking integration: NVLink, InfiniBand, and Spectrum Ethernet let customers scale to gigawatt-class clusters with NVIDIA-optimised interconnects.
- Full-stack reach: Systems (Vera CPU racks), networking, and developer libraries broaden the moat beyond the GPU itself.
- Inference tailwind: Training entrenchment is likely to translate into inference leadership as GPUs are repurposed and NVIDIA builds purpose-built inference products.
Financial strength
NVIDIA’s balance sheet is in outstanding shape, with $60.6 billion in cash and investments against $8.5 billion of debt as of October 2025. The cushion is ample to fund R&D through any cyclical downturn in chip demand.
Revenue growth has been exceptional: 126%, 114%, and 66% in fiscal 2024, 2025, and 2026. We model 80% growth in fiscal 2027, driven by an 86% expansion in the data centre segment to an estimated $361 billion. GAAP gross margin dipped to 71% in fiscal 2026 on Blackwell ramp costs and an H20 write-down, but should recover to the mid-70% range in fiscal 2027.
Operating leverage remains a defining feature. GAAP operating margin was 62% in fiscal 2025 and 60% in fiscal 2026, and we expect the high-50% to mid-60% band to hold through our forecast horizon.
Capital allocation
We assign NVIDIA an Exemplary Capital Allocation rating, reflecting a sound balance sheet, disciplined investment, and shareholder-friendly distribution policies. Management’s prescient, decade-long investment in GPUs, networking semiconductors, and CUDA software laid the groundwork for the firm’s AI dominance. Recent deployment has focused on extending the moat, including continued CUDA development and the Vera Rubin Ultra cycle expected in mid to late 2027.
On M&A, the standout deal remains the $6.9 billion Mellanox acquisition in early 2020, which now anchors a fast-growing networking franchise. Strategic investments in OpenAI and Anthropic are reasonable uses of cash; given the supply-constrained backdrop, the risk of NVIDIA pushing unwanted product onto these partners is minimal. Shareholder returns are dominated by buybacks; the quarterly dividend, initiated in 2013, remains immaterial relative to the firm’s earnings power.
Key risks
- Customer concentration: NVIDIA’s largest customers are a handful of hyperscalers, each with incentives to diversify away over time through in-house silicon (Google TPUs, Amazon Trainium and Inferentia) or alternative vendors.
- AI demand sustainability: AI infrastructure spending has been exceptional, but underlying end-customer revenue and return on investment remain less certain, raising the possibility of a digestion period or inventory correction in the medium term.
- Geopolitics and China exposure: US export restrictions have repeatedly curtailed NVIDIA’s ability to sell into China, and we no longer model meaningful China revenue. Further policy shifts in either direction remain a material swing factor.
Same as Ever – Chapter 10: Wild Numbers
In Chapter 10, Morgan Housel opens with a simple observation: most of what happens in markets, in business, and in life is shaped by extremes that almost never appear in our day-to-day expectations. We tend to plan for averages, building forecasts and assessing risk as though the normal range of outcomes is the most important one to understand. But Housel argues that the true drivers of long-term results are the rare, outsized events that sit far beyond the average. These are the wild numbers. They are uncommon, often unpredictable, and disproportionately consequential.
He illustrates the point with examples that span centuries. A handful of investment decisions account for most of Warren Buffett’s lifetime returns. A small number of stocks generate the bulk of the market’s gains across decades. Even in nature, a small percentage of trees account for most of a forest’s biomass, and a few storms cause most of the damage. The pattern repeats across domains. Most of the time, very little of significance happens. Then, occasionally, something extraordinary occurs, and that single event reshapes everything that came before and after it.
Housel’s point is not that the world is random, but that it is uneven. Outcomes cluster in ways that defy intuition. The mistake most people make is treating the quiet periods as the norm and the wild moments as anomalies. In truth, the wild moments are the norm in any system that runs long enough. They are simply infrequent.
The psychology behind it
The difficulty is that human beings are poorly equipped to think in terms of fat tails and rare events. Our minds are built for pattern recognition within familiar ranges. When we look at history, we tend to smooth it out, imagining a steady progression rather than the lurching, uneven path it actually followed. This creates a quiet but persistent overconfidence. We assume the future will resemble the recent past, and underestimate how often the extraordinary actually appears.
There is also a deep psychological discomfort with the idea that so much depends on so little. It is unsettling to accept that a portfolio or a career can be defined by a handful of moments that nobody saw coming. We prefer narratives in which effort, planning, and consistency produce results in a linear way. Wild numbers disrupt that story, reminding us that luck, timing, and rare events play a far larger role than we are usually willing to admit. Because these events are infrequent, they are also easy to dismiss in the moment. Familiarity with calm conditions breeds confidence that they will continue, even though history makes clear that they will not.
What This Means for Investors
For investors, the implications of Chapter 10 are profound. The returns that compound a portfolio over decades are rarely produced by steady, predictable performance. They are produced by a small number of exceptional years, exceptional decisions, or exceptional holdings. Missing those moments, whether by being out of the market, by selling too early, or by avoiding risk altogether, can quietly undermine an entire investment lifetime. The discipline of staying invested through ordinary periods is what makes participation in the extraordinary ones possible.
The corollary is equally important. Wild numbers cut both ways. A portfolio that is not built to withstand the rare downside event is one that may not survive long enough to benefit from the rare upside one. For private clients, this means accepting that diversification, prudent position sizing, and a long time horizon are not signs of timidity. They are the structural acknowledgement that the most important moments in markets are the ones we cannot predict. The investors who do best over time are those who position themselves to endure the wild numbers on the way down, so that they are still standing to receive them on the way up.
Graph of the month
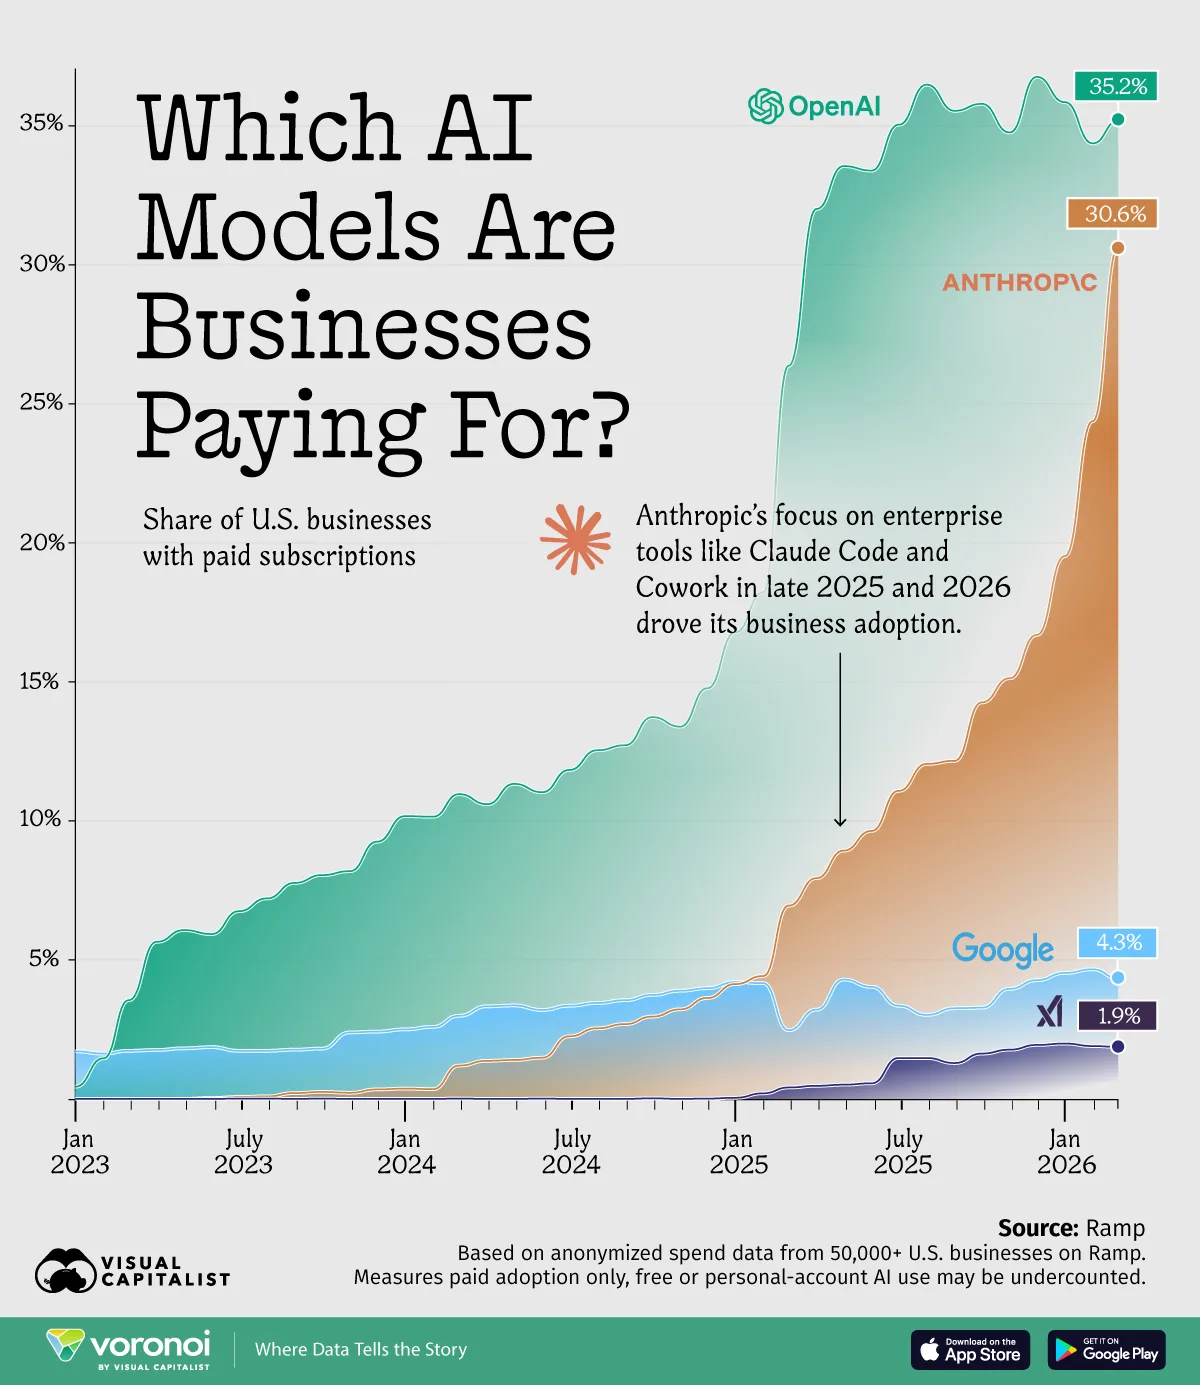
Source: Visual Capitalist
Disclaimer
VEGA Asset Management has taken care that all information provided in this document is true and correct. VEGA Asset Management does not accept responsibility for any claim, liability, loss, expense, or damage. Any information herein is not intended nor does it constitute financial, tax, legal, investment, or other advice. VEGA Asset Management is an authorised Financial Service Provider with FSP number 776. Past performance is not necessarily an indication of future performance.