January 2026 Newsletter
January’s newsletter reflects on a year defined by powerful themes and sharp contrasts. Global equity markets delivered strong headline returns in 2025, driven by US resilience, a rebound in Emerging Markets, and unprecedented investment in artificial intelligence. Beneath the surface, however, volatility, narrow market leadership, and shifting narratives shaped outcomes across regions. As we look ahead to 2026, the challenge for investors is not chasing stories, but navigating concentration risk, policy uncertainty, and the real pace of AI monetisation with discipline and perspective.
Categories:
Date Posted:
January 13, 2026
Highlights of this month’s newsletter:
“There will be two types of companies in the future. Those that are great at AI, and those that used to be in business.”
— Mark Cuban, American businessman and television personality
Market overview: performance figures (%)
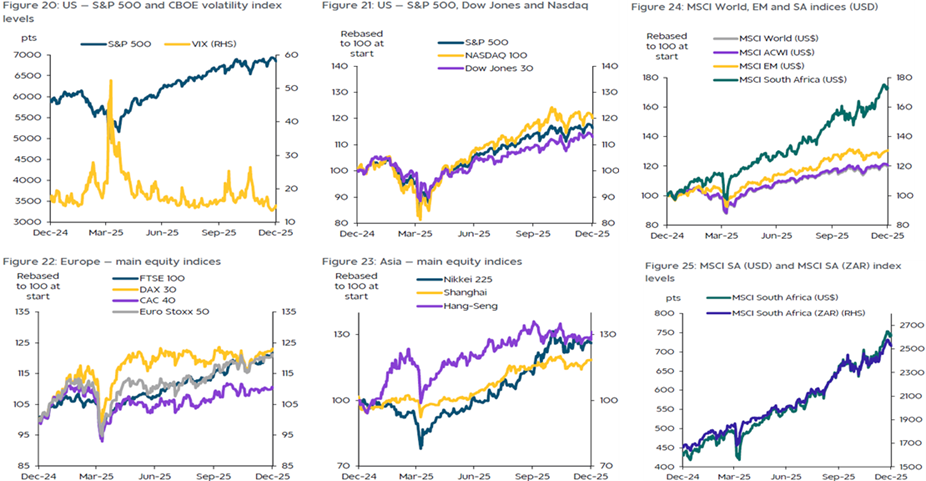
Source: RMB
International market overview

Source: Edmond de Rothschild
Global equity markets delivered robust returns in 2025, driven by a resilient US economy and a resurgence in Emerging Markets. While headline figures were strong, with the Nikkei and MSCI Emerging Markets up 25% and the S&P 500 gaining 16% the year was defined by high volatility and significant dispersion across regions and sectors.
Chart 1: Performance of the main equity indices in 2025 (in %)
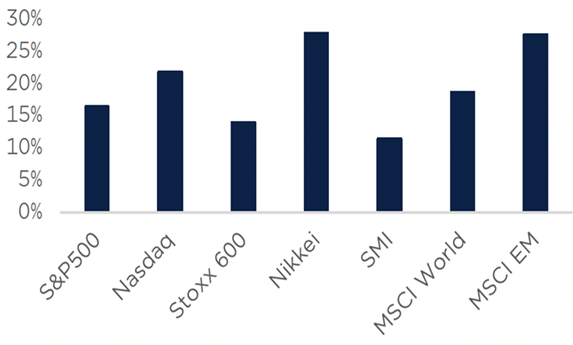
Source: Edmond De Rothschild
The core theme of “American Exceptionalism” remains intact, supported by innovation-led productivity, consumption-driven growth, and expansionary fiscal policy. However, market breadth remains narrow, heavily reliant on the AI investment cycle. In contrast, Europe struggled with structural headwinds, while Emerging Markets benefited from a weaker dollar and favorable trade negotiations.
US Market Analysis: The Engine of Growth
Performance and volatility
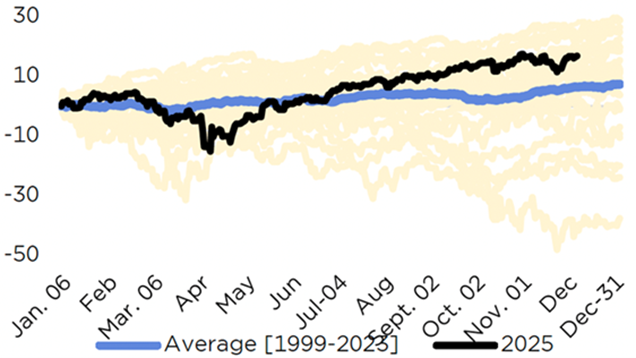
2025 was a year of sharp contrasts. Despite a 16% annual gain for the S&P 500, the path was non-linear. The year began with a sharp drawdown in the first four months, triggered by tariff announcements on April 2, followed by a historic rebound featuring nine consecutive months of gains between April and December.
Historically, 2025 ranks as the 13th strongest annual performance since 1928 and the third best since 2000, trailing only 2013 and 2019. The market recorded 37 new all-time highs, culminating in a peak of 6,890 points on October 28.
Chart 2: Calendar performance of the S&P 500 since 1999, in %
Source: Edmond De Rothschild
The “American Exceptionalism” thesis
US outperformance continues to be driven by three pillars which we believe will persist into 2026:
- Improved productivity: A direct result of continuous innovation and AI integration.
- Resilient economic growth: US GDP growth remains superior to developed market peers, anchored by robust domestic consumption.
- Expansionary policy: Fiscal stimulus continues to provide a tailwind for equities.
Sector Divergence and Concentration Risk
Market breadth remains a primary concern. Large-cap technology stocks masked weakness elsewhere:
- The Nasdaq returned 20%, outperforming the S&P 500 (16%) and the Russell 2000 (11%).
- The Equal-Weighted S&P 500 rose only 10%, highlighting the disproportionate impact of mega-caps.
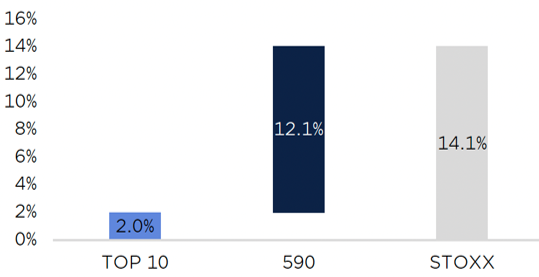
- Concentration: The top 10 stocks in the S&P 500 accounted for nearly 70% of the index’s total performance.
Chart 3: Contribution to the performance of the S&P 500 index in 2025 (in %)

Source: Edmond De Rothschild
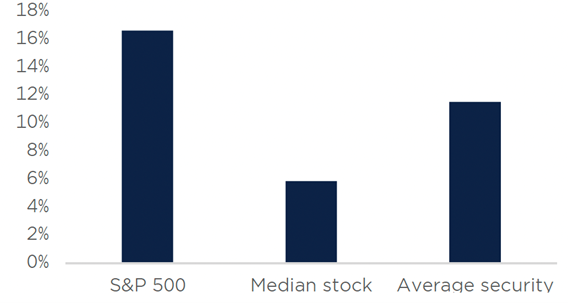
- Breadth: Only 26% of stocks outperformed the index. The median stock performance was just 6%, compared to the headline 17% global market weighted index.
Chart 4: S&P 500 performance in 2025 (in %)
Source: Edmond De Rothschild
End-of-Year correction
Following the October peak, markets entered a corrective phase driven by two factors:
- AI return on investment (ROI) concerns: Investors began scrutinizing the massive capital expenditures in Artificial Intelligence.
- Monetary Policy uncertainty: In late October, the Federal Reserve Chairman signaled that a December rate cut was not guaranteed.
This caused a pullback in AI-exposed names, specifically the Semiconductor Index (SOX). However, we view this correction as healthy, a normalization of valuations rather than the bursting of a bubble or a reversal in monetary policy.
European market analysis: Structural headwinds
Europe significantly underperformed the US and Emerging Markets in 2025. Despite initial optimism surrounding infrastructure and defense spending, the Eurostoxx 600 rose only 14%, held back by a lack of growth drivers.
Key Drivers of Underperformance
- Macroeconomic weakness: Low productivity, weak growth, and high household savings rates dampened demand.
- Energy costs: Energy prices remain 2–3 times higher than in the US, hurting industrial competitiveness.
- Trade sensitivity: High exposure to global trade and China left Europe vulnerable to trade war rhetoric.
- Political instability: Resurgent political risk, particularly crises in France and uncertainty regarding the German automotive sector and infrastructure execution.
Unlike the US, European concentration was low, but regional divergence was stark:
- Spain (IBEX 35): The standout performer, rising 45%. This was driven by a 40% weighting in financials, with Santander (+115%) leading the charge.
- Italy (MIB): Gained 27%, also buoyed by heavy financial sector exposure (44%).
- Germany (DAX 30): Returned 21%, supported by infrastructure plans despite industrial headwinds.
- France (CAC 40): The laggard, returning only 9%, weighed down by political uncertainty.
Chart 5: Performance of European indices and the Stoxx 600 in 2025 (base 100 as at 31 December 2024, in %)
Source: Edmond De Rothschild
Emerging markets & global assets
In a reversal of recent trends, Emerging Markets (EM) outperformed Developed Markets (DM) in 2025. The MSCI Emerging Markets Index surged 29% (USD terms) compared to 19% for the MSCI World.
- China rebound: The MSCI China rose 36%, fueled by a tech sector perceived as undervalued relative to US peers and a government anti-deflation plan that boosted margin expectations.
Chart 6: Performance of the Hang Seng and Shanghai vs MSCI Emerging

Source: Edmond De Rothschild
- Currency & trade: A weakening US Dollar and the conclusion of tariff negotiations agreed by the Trump administration provided a favorable backdrop for EM assets.
- Gold: Surged over 60%, transitioning from a hedge to a primary return driver in a “risk-on” year.
Conclusion
2025 was a unique year where the “AI buildout” contributed to roughly half of US growth, with investment contributions to GDP nearly triple the 2000–2019 average. While questions regarding the USD’s reserve status surfaced due to higher term premiums, they subsided as expected.
Looking ahead to 2026, we remain constructively bullish on US equities, driven by the structural advantages of the American economy. However, investors should remain cognizant of the extreme concentration in technology and the potential for continued volatility as the market digests the pace of AI monetization.
South African market overview

Source: Moneyweb, SARB
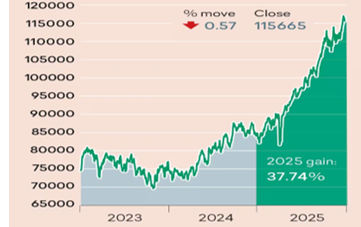
South African financial markets delivered an exceptional 2025. The JSE All Share Index rose 37%, the rand strengthened more than 12% to finish the year just below R16.60/$, and the benchmark 10-year government bond yield fell roughly 70 basis points to 8.21%. The strength in these asset classes stood in sharp contrast to an economy still constrained by weak growthand an unemployment rate near 32%
Chart 7: JSE All Share Index returns
Source: IRESS
Chart 8: JSE All-Share index 12-month forward PE ratio
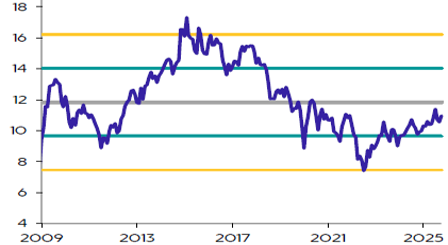
Source: RMB
A major driver of index gains was a surge in precious metals that turbocharged producers’ share prices. Gold’s record move beyond $4,000/oz saw Harmony more than double, Gold Fields almost triple, and Sibanye-Stillwater rise nearly fourfold. Platinum group metals also rallied as supply tightened, lifting Northam more than threefold, Impala close to double, and Valterra by around 150%.
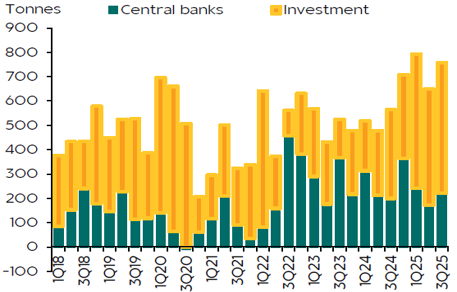
These trends may extend into 2026. PGMs are expected to benefit from firmer demand, while gold’s safe-haven appeal remains supported by global uncertainty and heightened geopolitical risk. Central bank purchases also continue to underpin the market, particularly from emerging economies seeking to reduce reliance on the US dollar.
The rand drew support from higher commodity prices and a softer dollar, amid rate cuts and US President Donald Trump’s tariff-driven policy and threats to undermine the Federal Reserve’s independence. Looking ahead, the currency will be shaped by broader dollar dynamics, the local rate cycle (with further cuts possible as inflation cools), commodity prices, and any improvement in domestic growth.
Chart 9: The USD/ZAR forecast

Source: RMB
The bond rally reflected growing belief that South Africa’s debt trajectory could stabilise at 77.9% of GDP in 2025/26, alongside Eskom’s operational improvements and an S&P ratings upgrade in November. While market performance does not eliminate the pressures faced by households, it can still matter: a firmer rand helps contain inflation via lower import costs, many pensions are linked to equity market outcomes, and declining yields reduce borrowing costs, potentially creating fiscal room for essential services.
Chart 10: Debt levels set to stabilize at about 80% of GDP
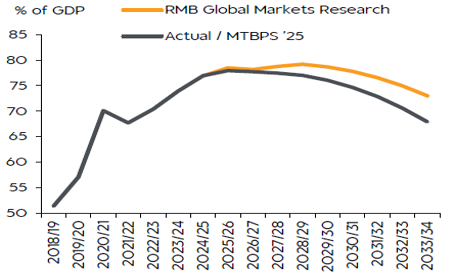
Source: Bloomberg, RMB Global Markets Research
Chart 11: Two-year ahead inflation expectations moderated to 4.2% in 3Q25
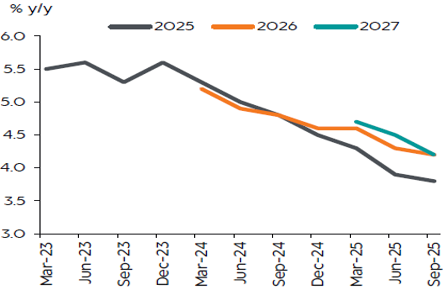
Source: Bureau for Economic Research, StatsSA, SARB, RMB Global Markets Research
Outlook
South Africa is undergoing a macro reset. A 3% inflation target, supportive external conditions, cyclical tailwinds from precious metals and a firmer currency, plus domestic progress (fiscal gains, an S&P upgrade and removal from the FATF grey list) have improved sentiment. We remain alert to the tension between these positives and enduring structural constraints—low growth potential, fragile public finances and high unemployment. After a powerful rally, we see room for further rand strength, but believe bonds may be stretched.
- Growth: 5% expected in 2026 (from 1.3%), with stronger outcomes in 2027–2028, dependent on energy/logistics reform, rising confidence and investment.
Chart 12: Business confidence improved to 44 index points in 4Q25
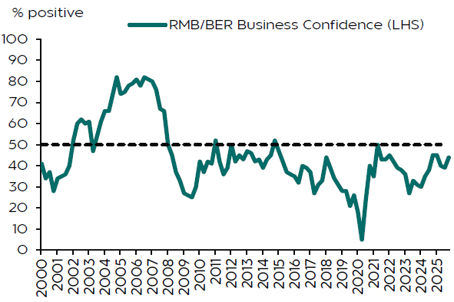
Source: BER, SARB, RMB Global Markets Research
- Inflation: headline CPI forecast to average 3.1% (2026), 3.4% (2027), 3.5% (2028), supported by lower oil, a stronger rand and imported disinflation.
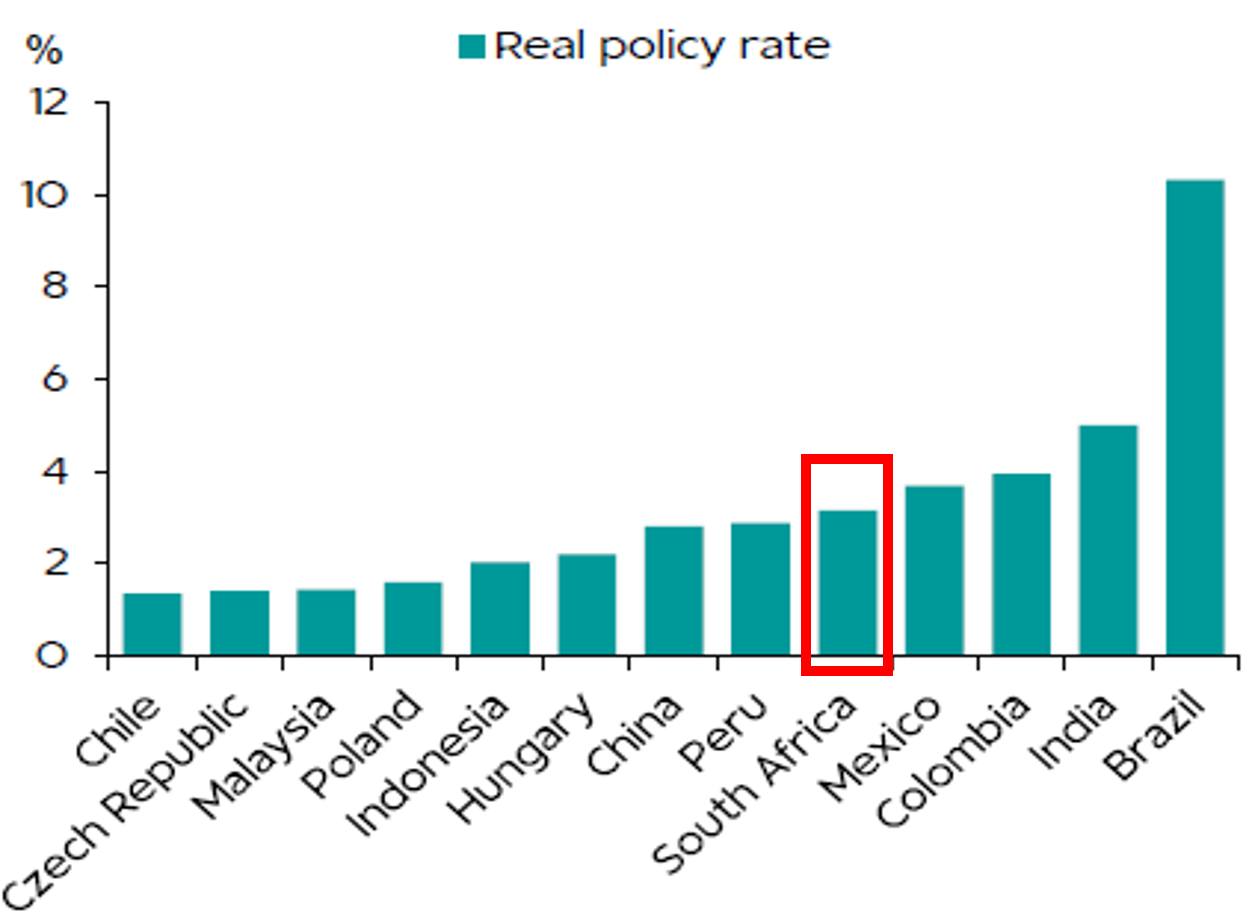
- Rates: 50bp of SARB cuts expected in 2026, with the next move likely in March as inflation slows toward the new target.
Chart 13: South Africa’s current real policy rate relatively high against other emerging markets
Source: SARB, Bloomberg, RMB Global Markets Research
- External position: stronger export earnings from higher precious metal prices; current account deficit forecast to narrow to 0.3% of GDP in 2026.
- Currency: USD/ZAR projected at 16.50 by 2Q26; the rand looks stronger than fair value, but that may persist through 2026–2027.
- Fiscal path: consolidation supported by tax/compliance gains, commodity windfalls and lower debt-service costs, though debt is expected to remain near 80% of GDP.
- Bonds: after ~180bp of yield compression, a modest retracement in SAGBs is expected in the near term.
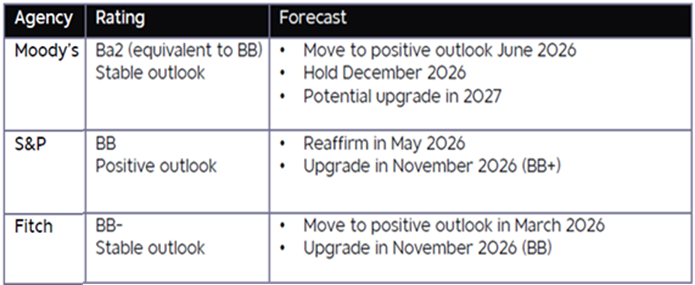
- Ratings: potential upgrades pencilled in, Fitch to BB and S&P to BB+ by end-2026.
Chart 14: Foreign currency long-term ratings
Source: Moody’s, S&P, Fitch
- Politics: municipal elections due between 2 November 2026 and 1 February 2027, with attention on metro outcomes and implications for the GNU and ANC leadership.
- Global risks: tariffs, geopolitics, and fragmentation remain key uncertainties; the baseline assumes decent global growth, ongoing Fed cuts, and mild dollar weakness.
- Commodities: precious metals favoured; a weaker USD supports industrial metals; China’s supply constraints weigh on bulk metals; oil expected to trade below $60/bbl amid global surplus.
Chart 15: Central bank and investment purchases of gold
Source: World Gold Council, Bank of International
VEGA Global Strategic Fund Update
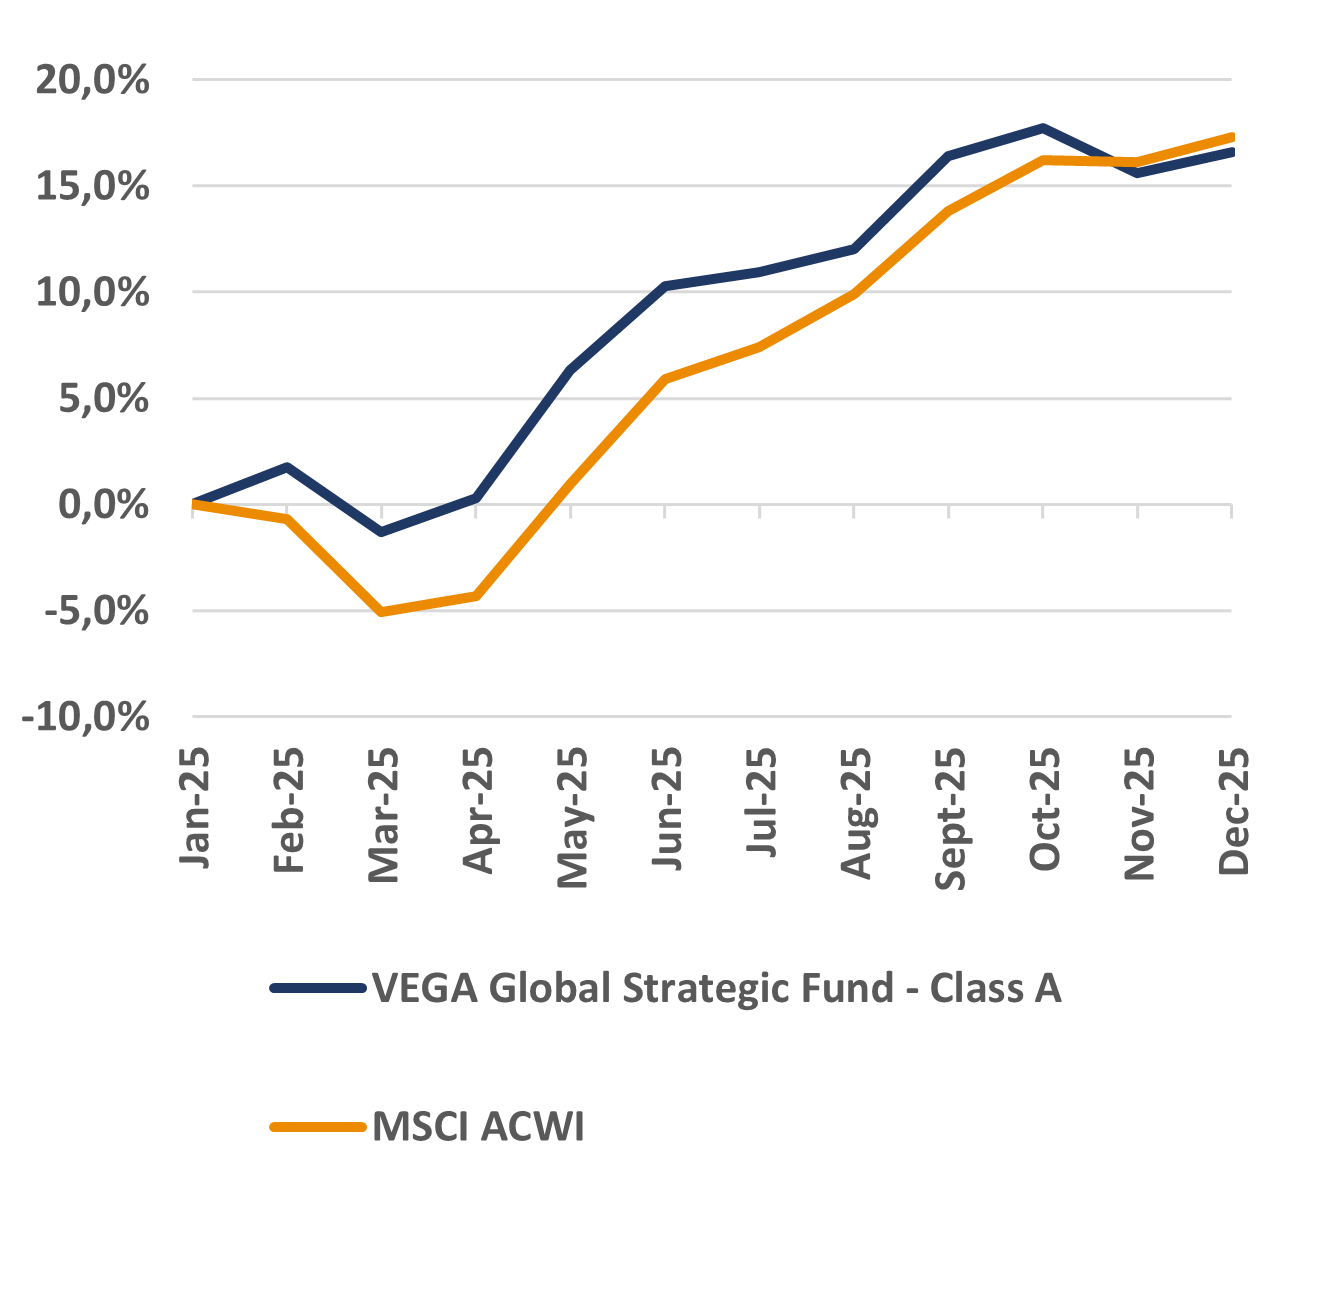
In December, the VEGA Global Strategic Fund increased by 1%, compared with a 0.9% gain in the MSCI All Country World Index, our reference benchmark, in USD terms. Since inception, the fund has gained 16.6%, versus the benchmark’s 17.3%. The underperformance was mainly due to short-term weakness in several growth and emerging-market holdings, which lagged as markets rotated toward more defensive sectors.
Chart 16: Total return in USD since inception
Portfolio strategy
In the wake of heightened market volatility following President Trump’s tariff announcements, our stance has been to remain disciplined and avoid reactive portfolio shifts. History consistently shows that impulsive responses to short-term political noise often result in suboptimal investment outcomes.
Instead, we have used this environment to evaluate high-quality businesses that were indiscriminately sold off despite their strong long-term fundamentals. Periods of uncertainty can create attractive entry points into quality companies at compelling valuations, and we continue to focus on identifying these opportunities with a long-term perspective.
The portfolio remains concentrated in leading global businesses with durable competitive advantages, particularly those delivering high returns on capital and robust free cash flow generation. Dividend policies are not a central consideration in our selection process, as we generally favour companies that reinvest earnings to drive future growth.
We also resist the temptation to follow short-lived market trends or fashionable investment narratives, as preserving portfolio quality takes precedence over chasing momentum.
Changes which were made during the month
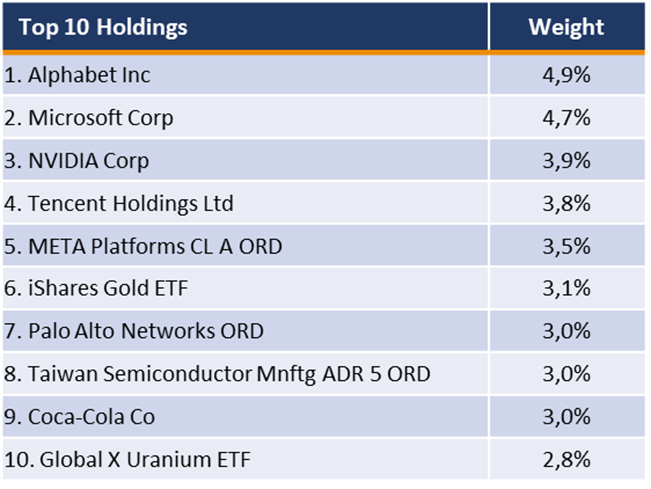
Alphabet — Increased position
We increased our allocation to Alphabet, which has now become the fund’s largest holding. The company’s strong execution across digital advertising, cloud computing, and artificial intelligence continues to underpin our conviction in its long-term compounding potential. We view Alphabet as a core growth engine within the portfolio.
Intuitive Surgical — Increased position
We added to Intuitive Surgical, reflecting confidence in its dominant position in robotic-assisted surgery and the expanding adoption of its da Vinci system globally. The company’s recurring revenue model and strong innovation pipeline support a long runway for growth.
Meta Platforms — Increased position
We increased our holding in Meta Platforms, underpinned by robust advertising demand and margin recovery. The firm’s disciplined cost management and continued leadership in social platforms and AI integration reinforce our positive outlook.
Siemens — Increased position
We raised our position in Siemens to strengthen exposure to high-quality industrial automation and electrification trends. Siemens’ diversified portfolio and focus on digital transformation make it a key beneficiary of global industrial upgrades.
Novo Nordisk — Removed position
We exited our holding in Novo Nordisk after a sustained drawdown in the share price. While we still recognise the strength of the underlying business, the position had detracted meaningfully from performance, and we chose to reallocate capital to higher-conviction opportunities elsewhere in the portfolio.
Top 10 Holdings
Monthly returns in USD net of fees

Share of the month: Alphabet
Alphabet stands out as a “conglomerate of stellar businesses,” anchored by an exceptionally strong advertising engine and reinforced by meaningful optionality in cloud, AI and emerging “Other Bets.” The core strategy is clear: protect and strengthen Google Search (still the primary profit pool), while steadily expanding the contribution from Google Cloud and YouTube subscriptions, together underpinning tens of billions of dollars in annual free cash flow.
At the centre is Google Search, where Alphabet benefits from powerful intangible assets (brand and technical leadership), a reinforcing network effect between users and advertisers, and meaningful pricing power through its auction-based ad model. The company continuously improves search functionality and uses signals from user behaviour to increase advertising effectiveness, supporting attractive returns for advertisers and reinforcing Search’s role as a foundational channel in digital marketing budgets. While competition exists in specialised areas (such as retail, social and local discovery), these are largely complementary rather than true substitutes for general search, and the structural cost of building a competitive general search engine remains a high barrier to entry.
Alphabet’s accelerating investment in AI is positioned as a logical extension of this defence-and-extend strategy. By integrating generative AI into Search (including features such as AI Overviews) and enhancing ad targeting, Alphabet aims to improve the user experience while simultaneously strengthening monetisation. Importantly, despite high-profile antitrust scrutiny, particularly around Search distribution agreements, the base view in the document is that remedies are unlikely to cause a material long-term deterioration in Search economics or push returns below the cost of capital.
Beyond Search, YouTube is framed as a wide-moat business with scale-driven advantages: a massive global audience attracts creators, creators drive more watch time, and that watch time supports both advertising and subscriptions. The platform’s reach across devices (including TV) and its ability to innovate (for example, Shorts) are highlighted as key to defending engagement in a competitive landscape. YouTube’s growing subscription base (across Premium, Music and YouTube TV) adds resilience and further diversifies Alphabet’s cash generation beyond pure advertising.
Google Cloud Platform is described as a major growth lever over the next five years, supported by continued cloud migration and rising AI deployment. Alphabet has real competitive strengths here, cost advantages from global-scale infrastructure and proprietary TPUs, and high customer switching costs once workloads are embedded. As the platform scales, profitability is expected to improve, making Cloud a much more material share of Alphabet’s revenue and earnings mix, thereby increasing its strategic importance to the overall investment case.
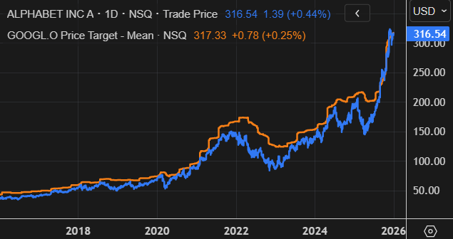
From a balance-sheet perspective, Alphabet is portrayed as exceptionally robust, ending 2024 with roughly $96 billion in cash and cash equivalents versus about $11 billion in debt. On valuation, the document’s base-case fair value is $340 per share, underpinned by an expectation of ~13% revenue CAGR over five years and limited margin expansion due to heavy data-centre and AI-related capex (and associated depreciation).
The scenario framework is also helpful: a bear case (AI-led search disruption) implies $230, while a bull case (Search resilience plus strong Video/Cloud momentum) implies $390, with a sum-of-the-parts view landing around $350 and highlighting Cloud as a meaningful driver of intrinsic value.
Did you know?
Alphabet has a few “wow” stats that highlight just how embedded it is in everyday digital life:
- Google Search has held 80%+ share of general search since 2009 (and 90%+ on mobile), to the point where “google” is recognised as a verb.
- Android powers more than two-thirds of the world’s smartphones, reinforcing a near-duopoly in mobile operating systems. And YouTube (acquired in 2006) has 2+ billion monthly users, with 1 billion hours watched daily on TV alone, plus 100+ million Music/Premium subscribers and 8+ million YouTube TV subscribers, all backed by a balance sheet that closed 2024 with $96bn cash vs $11bn debt.
Chart 17: Alphabet’s share price and target price
Source: LSEG
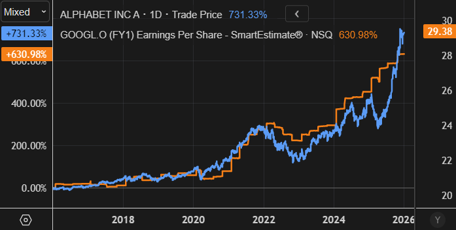
Chart 18: Alphabet’s share price growth versus EPS growth
Source: LSEG
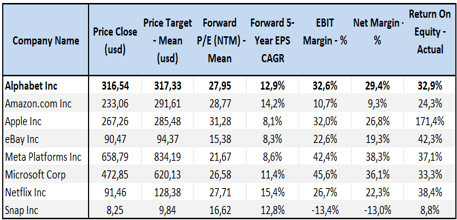
Chart 19: Peer analysis
Source: LSEG
Same as Ever – Chapter 5: Stories are seductive
In Chapter 5, Morgan Housel examines the profound influence of narrative on human behaviour. While data, statistics, and probabilities describe how the world operates, stories truly motivate people. Because human nature is constant, this gap between narrative and reality persists throughout history.
People do not experience life through spreadsheets, but through stories. We remember narratives, not numbers. We decide based on emotion, identity, and meaning, not probabilities. As a result, compelling stories often overwhelm facts, even if the facts matter more.
He notes that stories impose structure on chaos. They distill complex situations into forms we can grasp, relate to, and share. But such simplicity has a price. To craft a compelling story, we often eliminate nuance, ambiguity, and randomness, key elements in real life and investing.
One danger of stories is that they create a false sense of certainty. When events are explained through a neat narrative, it feels like the outcome was inevitable or predictable, even if it wasn’t. This is why hindsight is so misleading: once a story is formed, it becomes hard to remember how uncertain the world felt beforehand.
Housel also highlights that stories tend to exaggerate intention and intelligence. Success is often attributed to skill, vision, or genius, while the role of luck, timing, and randomness fades into the background. This makes outcomes appear repeatable when they are not and encourages people to copy strategies that worked once without understanding the context that made them possible.
In summary, the chapter shows that while stories are unavoidable and often useful, they are also dangerous when mistaken for reality.
What This Means for Investors
For investors, Chapter 5 issues a crucial warning: markets are propelled by narrative, but returns are earned through discipline.
- Be cautious of clean, compelling narratives explaining why an investment “must” succeed. The better the story, the more likely it is that complexity and risk have been ignored.
- Similarly, don’t confuse a good explanation with a good investment. Stories can make outcomes feel obvious in hindsight, even when they were driven by luck or unique circumstances.
- It is also important to accept uncertainty. Real investing is messy, probabilistic, and uncomfortable and no story can fully capture that.
- Therefore, focus on process rather than narrative. A sound strategy matters more than a convincing explanation.
Stories will always influence markets and headlines. They shape investor sentiment. Long-term success comes from recognizing when a story affects your emotions, then pausing to ask if the facts and odds truly justify your decision.
Investors should also be wary of stories they tell themselves. Every portfolio has a narrative attached to it, why certain assets were chosen, why risks are acceptable, and why the strategy will work. Over time, these internal stories can become comforting and hard to challenge, even when the facts change.
“Stories are the most powerful force in the world. They are how we understand complexity — and how we often misunderstand it.” — Morgan Housel
Graph of the month
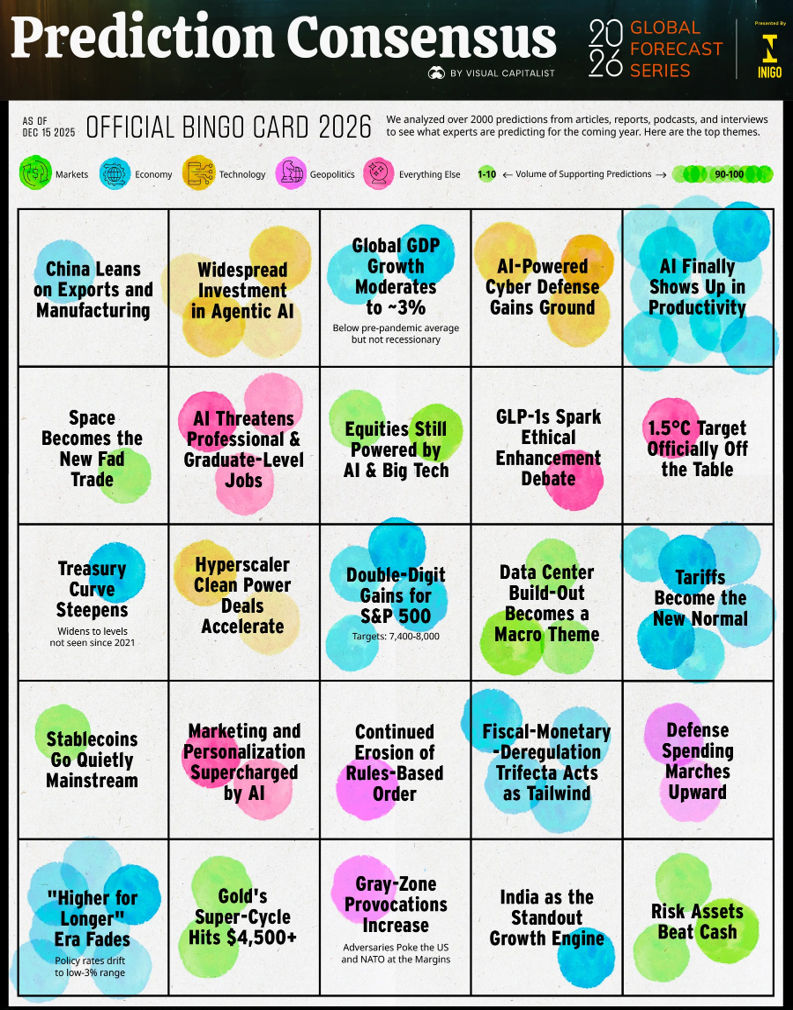
Source: Visual Capitalist
Sources
Alpine Macro, Anchor, Bloomberg, BNY Mellon, Charlie Bilello, Compound Advisors, Edmond De Rothschild, ETFMG, FactSet, Haver Analytics, JP Morgan, Julius Baer, LSEG, Morningstar, Morgan Stanley, Refinitive, RMB, Statista, Sygnia, Strategas, The Intelligent Investor, UBS.
Disclaimer
VEGA Asset Management has taken care that all information provided in this document is true and correct. VEGA Asset Management does not accept responsibility for any claim, liability, loss, expense, or damage. Any information herein is not intended nor does it constitute financial, tax, legal, investment, or other advice. VEGA Asset Management is an authorised Financial Service Provider with FSP number 776. Past performance is not necessarily an indication of future performance.