October 2026 Newsletter
VEGA’s October 2026 newsletter examines how rising interest rates, elevated oil prices and developments in artificial intelligence are shaping global and South African markets. This edition includes the VEGA Global Strategic Fund update, a closer look at the KraneShares Humanoid Robotics ETF (KOID), and Morgan Housel’s lessons on the investment risks of pursuing perfection.
Categories:
Date Posted:
October 8, 2026
Highlights of this month’s newsletter:
“The library is the temple of learning, and learning has liberated more people than all the wars in history.”
― C.T. Rowen
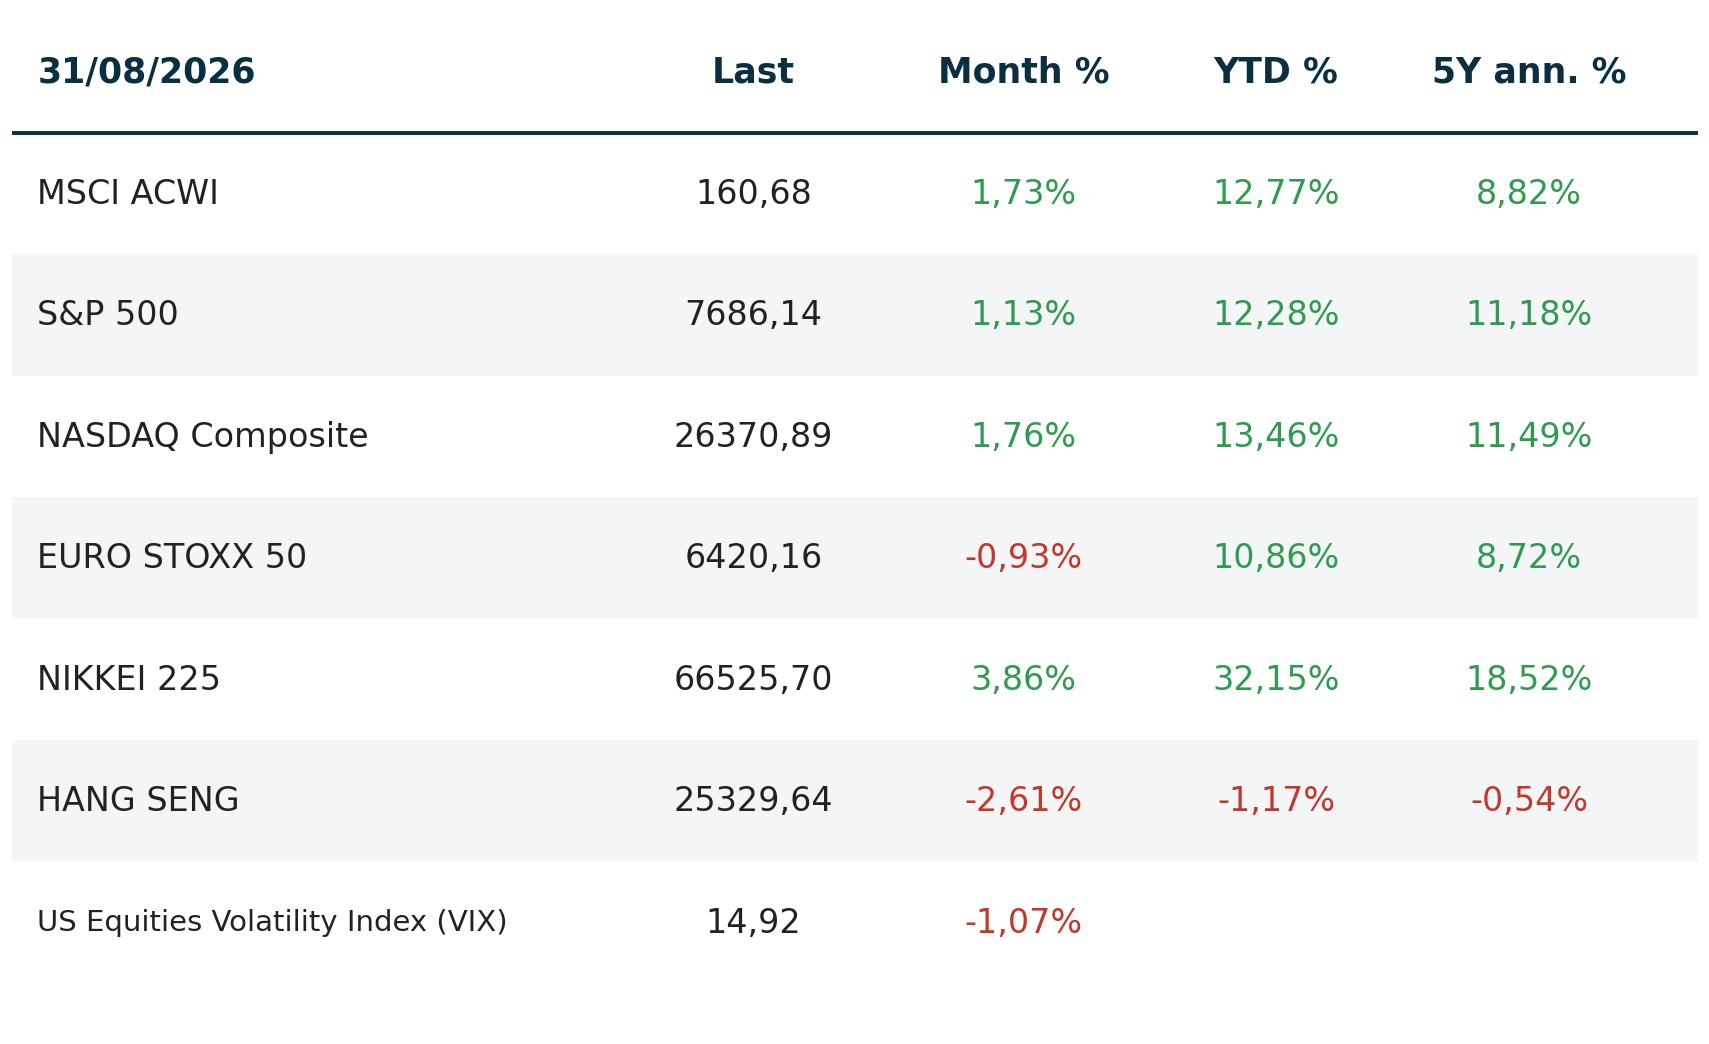
Market overview: performance figures (%)
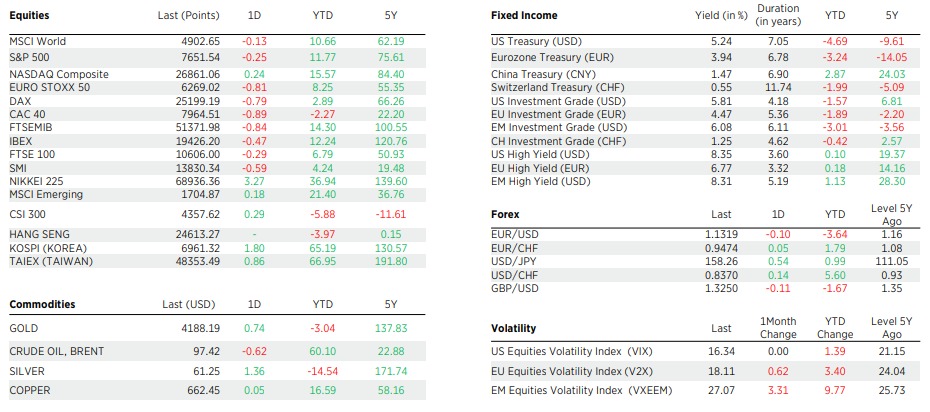
Source: Edmond de Rothschild, 30.09.2026
International market overview
Source: Edmond de Rothschild
International market overview
September has a reputation as the market’s most dangerous month, and this year it arrived with no shortage of reasons to worry: central banks raising interest rates, oil above $100 a barrel, government bond yields at multi-decade highs and a sudden scare over the future of artificial intelligence (AI). Global equities held their ground regardless. The MSCI All Country World Index (ACWI) remains close to its all-time high and is up nearly 11,5% year to date. Below we look at what drove markets and what it means for the months ahead.
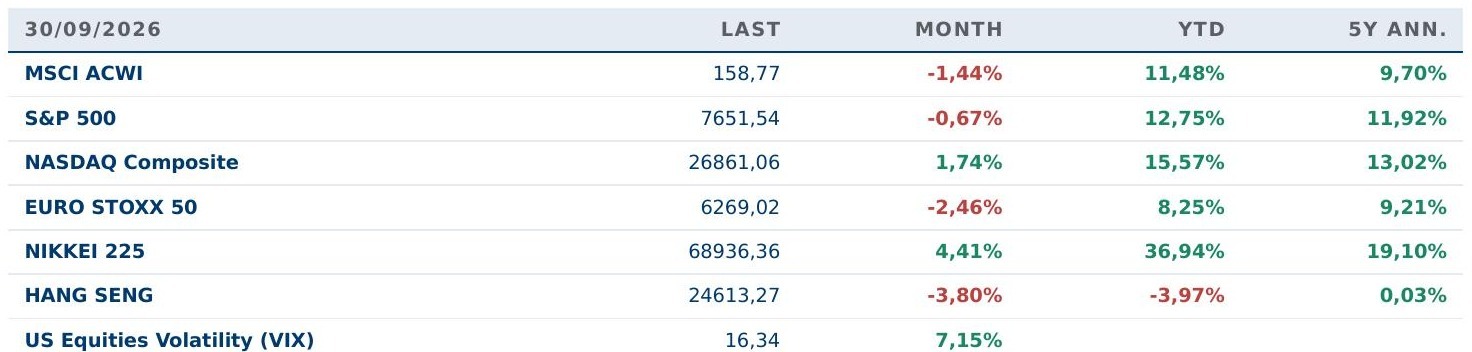
Source: Edmond de Rothschild
Central banks: the hawks are back
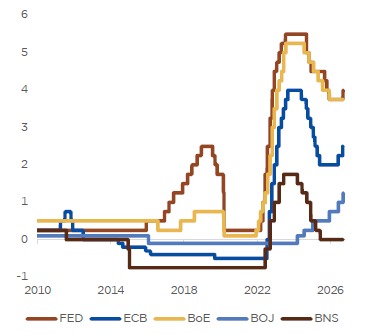
The defining story of the month was the return of rate hikes. The US Federal Reserve raised rates by 25bp, its first increase in more than three years. Fed officials expect one further hike this year, and markets are pricing in more than that. The European Central Bank (ECB) delivered its second hike of 2026, and the Bank of Japan (BoJ) also tightened, partly to support a weak yen. The Bank of England (BoE) held rates steady, although markets see a strong chance of a hike in November. As Graph 1 shows, developed market (DM) central banks are now moving in the same direction, which may mark the start of a broad DM hiking cycle.
The motivation is the same everywhere. The conflict with Iran has pushed energy prices sharply higher, and central banks are acting pre-emptively to stop that from feeding into broader inflation. Bond markets have responded accordingly.
Graph 1: Key interest rates of major central banks (%)
Source: Edmond de Rothschild
Yields on the rise
Higher rate expectations have pushed government bond yields up across the globe. The US 10-year Treasury yield is approaching 5%, a level many analysts regard as a threshold beyond which equity valuations come under real pressure. In Europe, France stood out for the wrong reasons: its 10-year yield climbed to 4.57%, an 18-year high, after the government conceded it would miss its 2026 deficit target and cut its growth forecasts.
Oil and geopolitics
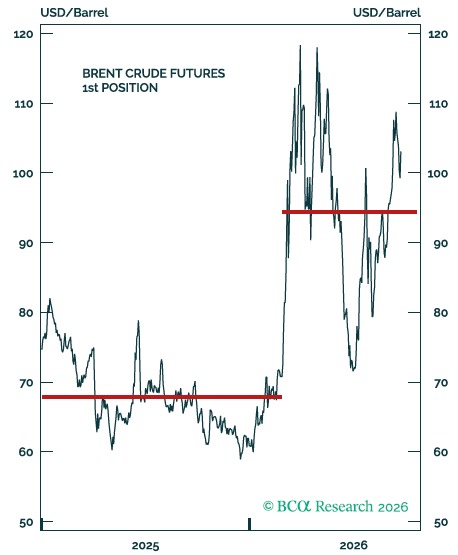
Energy remained the main pressure point. Brent crude has averaged more than $94/bbl since the Iran conflict began in March, compared with $68/bbl beforehand. It traded above $100 for much of September after Iran-backed Houthi rebels seized a key maritime chokepoint, threatening one of the world’s most important oil corridors. Ukraine added to supply disruptions by striking a major Russian refinery.
Prices eased later in the month as US–Iran negotiations explored a phased exit from the war that would reopen the Strait of Hormuz and lift the US blockade. Brent nonetheless remained elevated, settling at $104.32/bbl on 25 September (Graph 2).
Graph 2: Oil prices in $ per barrel
Source: BCA Research 2026
Beyond oil: commodities and trade
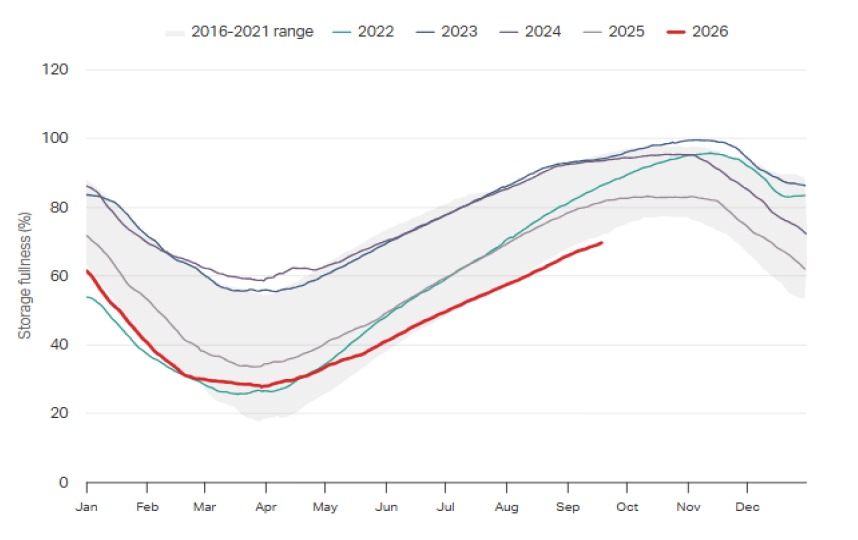
Price pressure is no longer confined to oil. The Bloomberg Commodity Index is now above its 2022 peak, which translates into higher input costs for businesses and higher prices for consumers. Europe also faces a winter risk: as Graph 3 shows, European gas storage in 2026 (red line) sits well below the September levels recorded in every year from 2016 to 2025.
On trade, the Xi–Trump summit offered some relief. The US and China agreed to extend their trade truce to 10 January, reduce tariffs on $30 billion of goods and open a dialogue on AI. That last step is timely, given that AI triggered one of the month’s sharpest market scares.
Graph 3: European Union gas storage by day of year
Source: Edmond de Rothschild
AI jitters, and why a slowdown isn’t realistic
Mid-month, executives from leading AI firms, including Anthropic and OpenAI, proposed slowing the pace at which new frontier models are developed, citing safety concerns. The news sparked a global tech sell-off, with Nvidia falling 3.4% and much of the sector following.
The sell-off faded quickly, and we doubt a broad slowdown is achievable in practice. The biggest obstacle is geopolitics. The US and China are competing for AI leadership, and neither wants to blink first. At the late-September summit, the two countries agreed only to a communication channel for AI incidents, with no commitment to jointly develop or regulate frontier models. President Trump has ruled out cooperation with China on “superintelligence”, arguing that the US is well ahead.
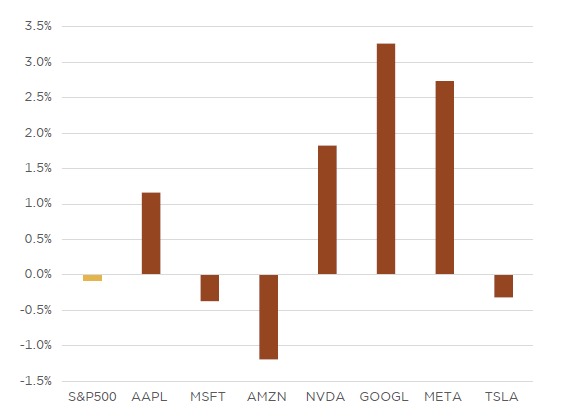
At the same time, hundreds of billions of dollars are already committed to data centres and chips. These are multi-year projects that will not be halted overnight. The safety debate is genuine and may well shape future regulation, but we see no material change to the investment case. Markets appear to agree: Graph 4 shows most of the Magnificent Seven outperforming over the past week.
Graph 4: Magnificent Seven vs S&P 500 performance over the past week
Source: Edmond de Rothschild
Equities: September’s reputation not earned this time
History is not kind to September. Since 1928, the S&P 500 has returned an average of -1.17% in the month and has fallen in 56% of years, making it the only month with a negative long-term track record. This year broke the pattern. Despite a Fed hike, $100 oil and a mid-month AI sell-off, the S&P 500 ended the month roughly flat to slightly higher. Last week alone, the S&P 500 gained 0.6% and the Nasdaq 100 rose 2.1%.
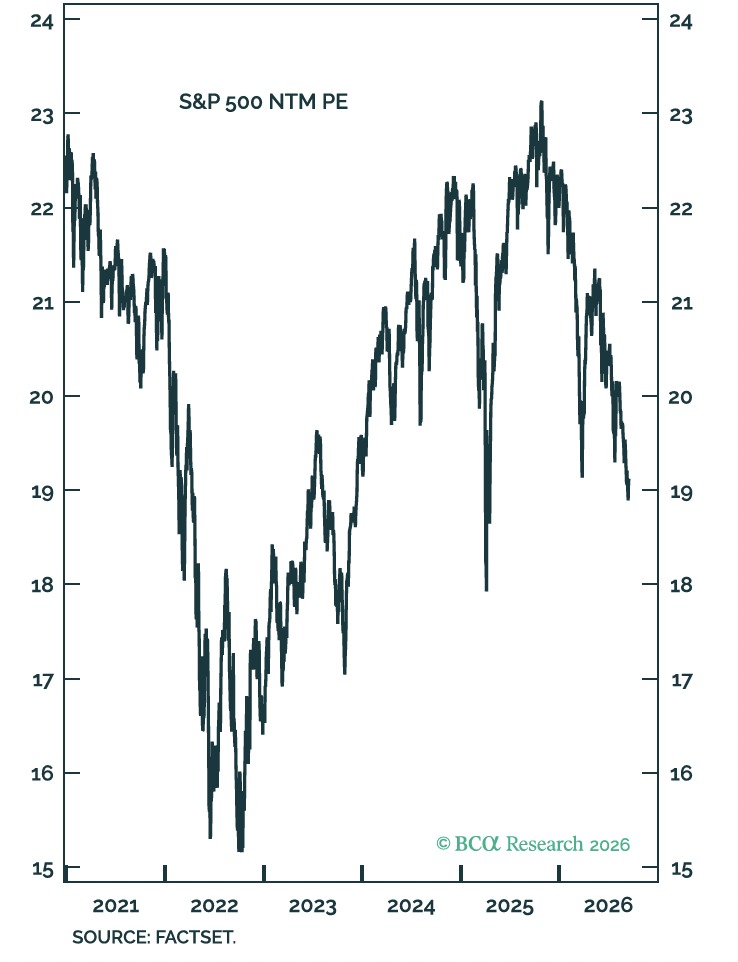
History also offers reassurance on rate hikes: since 1983, the S&P 500 has gained about 7% on average in the 12 months following the first Fed hike of a cycle. Equity valuations have also fallen to their lowest level since early 2025, suggesting that much of the rate shock is already priced in (Graph 5).
Graph 5: S&P 500 P/E – Lowest level since early 2025
Source: FactSet
Our view: Stay invested, but be selective
September demonstrated how resilient markets can be. Equities absorbed higher rates, expensive energy and an AI scare, and remain close to record highs. Risks remain as we enter the fourth quarter, including further rate hikes, the Iran conflict, the US midterm elections and Europe’s winter energy position. But history suggests that hiking cycles alone do not end bull markets. In this environment, quality matters: companies with strong cash flows, reasonable valuations and low debt are best placed to absorb higher rates. At VEGA, we continue to invest in such businesses while staying diversified, including exposure to gold and real assets for as long as geopolitical uncertainty remains elevated.
South African market overview
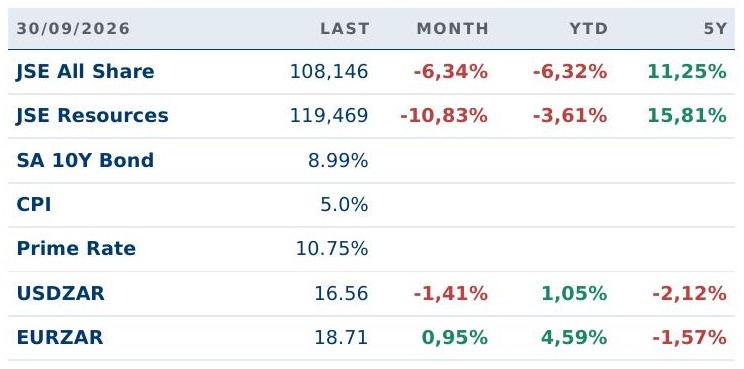
Source: Moneyweb, SARB
SARB hikes to 7.25% as the fuel shock intensifies
The Reserve Bank raised the repo rate by 0.25 percentage points to 7.25%, with all committee members in agreement. This takes the prime lending rate to 10.75% and is the second increase this year. Governor Kganyago explained that fuel prices have become a bigger problem again, while interest rates around the world are also rising. The Reserve Bank expects inflation to go above 5% later this year before gradually easing to around 3% by the end of 2027. This means higher repayments on home and car loans, but better returns for savers and money market investors.
Gold slips as global interest rates rise
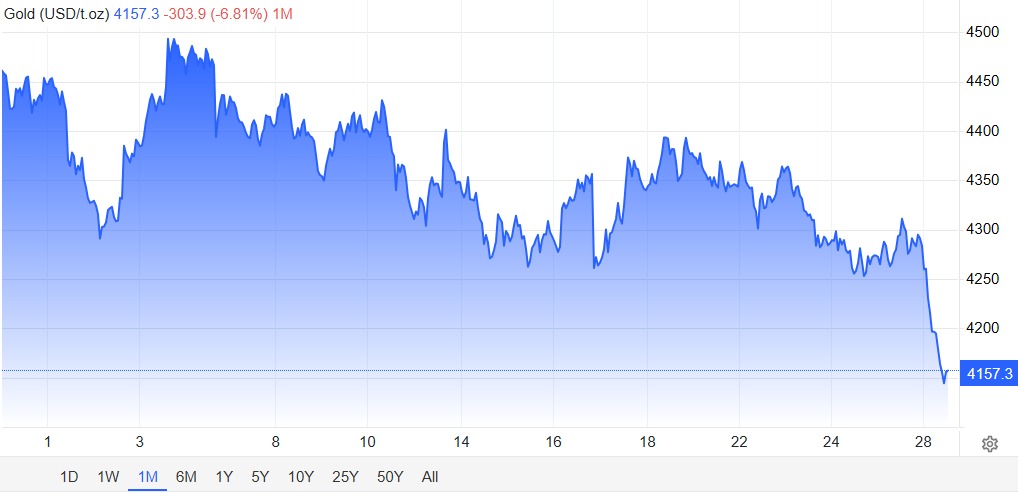
Gold had a difficult September. The price slipped to $4,157 an ounce on 28 September, down more than 4% for the week, as higher US interest rates and expectations of further Fed hikes reduced the appeal of a metal that pays no income.
That leaves gold roughly 30% below its January record, although it is still higher than its $3,833 price a year ago. For South African investors, the weaker rand softened the blow. Gold miners remain profitable at these levels, reporting record profits and sharply higher dividends.
Graph 6: Price of gold
Source: Trading Economics
US tightens pressure with visa bans
On 15 September the US announced it would refuse visas to people it holds responsible for race-based policies and land expropriation without compensation in South Africa, and to their families. It specifically pointed to BEE policies and the 2024 Expropriation Act. The US ambassador described this as only the first step in a series of stronger measures. South Africa’s Minister of International Relations, Ronald Lamola, rejected the bans and called for dialogue. The direct economic impact is small for now. The risk is that the dispute could later spread to trade or financial measures, which would weigh on investor confidence.
Rand loses ground as oil prices climb again
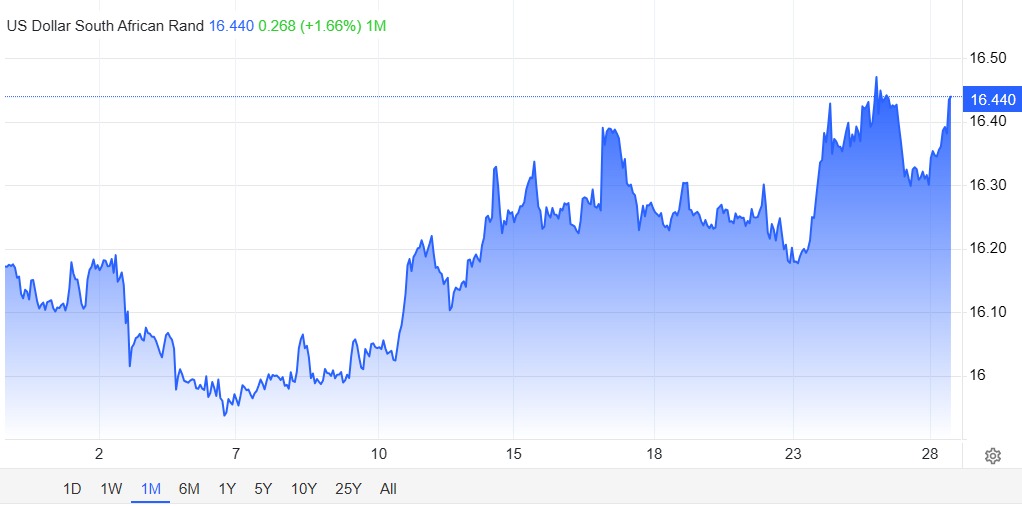
The rand gave back its August gains in September. It weakened from around R15.95 to the US dollar early in the month to R16.44 by 28 September, as a firmer dollar, higher energy prices and softer gold and platinum prices raised concerns about inflation and the cost of imports. Attacks on Saudi oil infrastructure pushed oil prices up, which hurts South Africa because we import most of our fuel.
Graph 7: South African Inflation Rate
Source: Investing.com
ANC misses the deadline to register candidates
The ANC failed to register 181 of its candidates in six municipalities before the deadline for the local government elections. The party blamed a technical problem with the online system, but the Electoral Commission (IEC) said the ANC simply ran out of time. The IEC noted that the party had received training and a reminder two days before the deadline.
The Electoral Court ruled against the ANC, meaning it will have no councillors at all in strongholds such as Port St Johns and Ngquza Hill. The ANC has now turned to the Constitutional Court.
Strong results support JSE, but September jitters weigh
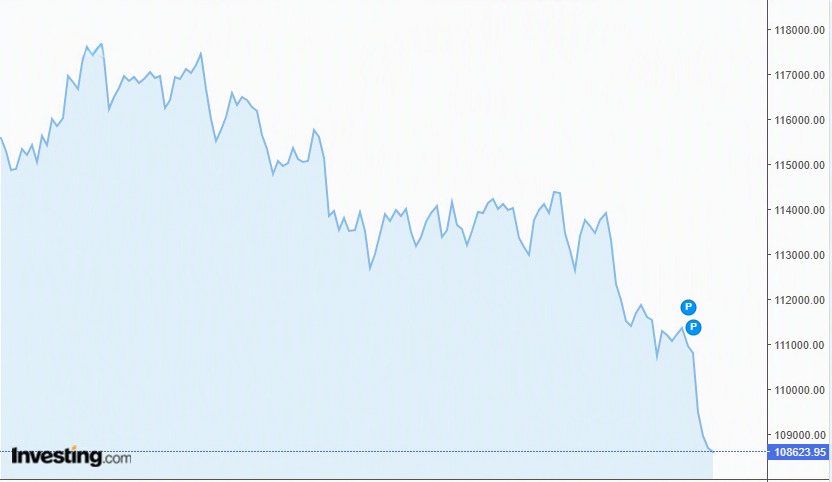
South African shares started September on a positive note. The JSE All Share Index closed strong the first week, supported by strong company results and a recovery in gold and platinum shares. Discovery reported a 34% jump in headline earnings to R12.9 billion, and Harmony Gold reported a record annual profit of R29.5 billion on the back of high gold prices. The index is still about 10% below its early 2026 peak. Sentiment weakened later in the month. On the day of the rate hike, the rand lost more than 1% and closed near R16.40 to the dollar, while long-term bond yields rose and shares fell. Rising US interest rates and the November local elections are likely to keep markets volatile in the coming weeks.
Graph 8: JSE All Share price (1 month)
Source: Trading Economics
VEGA Global Strategic Fund Update
September was a challenging month for the VEGA Global Strategic Fund. Over the month, the fund declined 2,6% while the MSCI All Country World Index, our reference benchmark, declined 1,2% in USD terms. Despite the short-term setback, we remain focused on the long-term opportunities within the portfolio and committed to our investment approach.
Graph 9: Total return in USD*
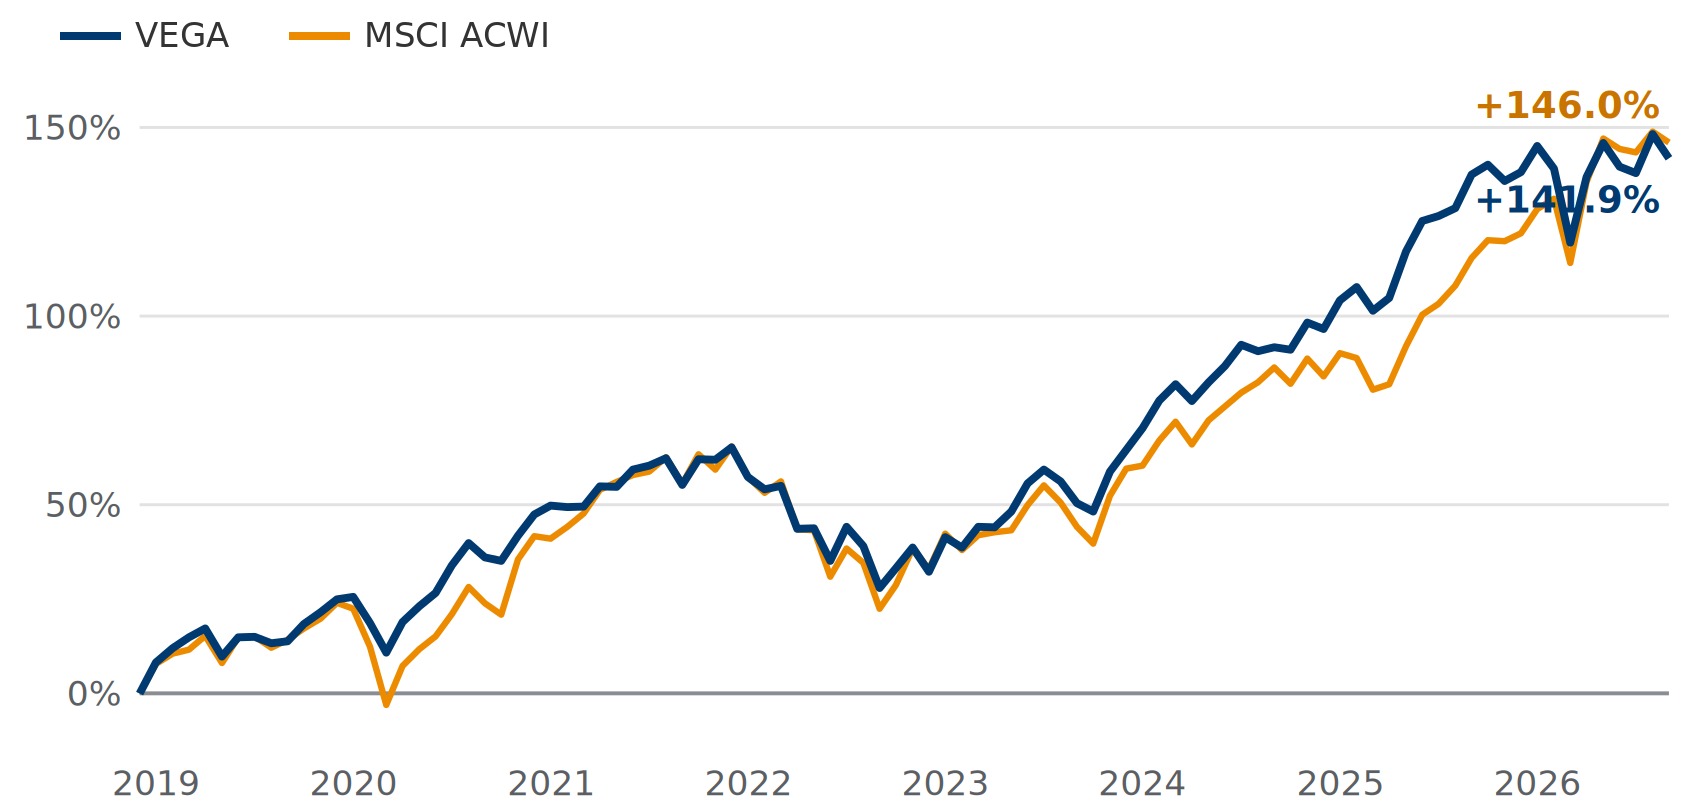
* The VEGA Global Strategic Fund launched in its current structure on 3 February 2025. Performance figures prior to this date represent the same investment strategy and process in an unregulated structure managed by Storm Capital Limited and VEGA Asset Management in the VEGA Global Equity Segregated Swissquote accounts.
Changes during the Month:
Added – Lockheed Martin Corporation (LMT). Lockheed Martin is a US aerospace and defence company and one of the largest defence contractors in the world, responsible for the F-35 fighter jet programme, missile and fire-control systems, Sikorsky helicopters and space systems. We added the position as a hedge against market volatility, as its returns are defensive in nature. The company’s massive order backlog effectively locks in revenue for years ahead, supporting stable and steady returns regardless of the wider economic cycle. Demand is also being reinforced by the ongoing war, which has depleted US missile stockpiles and increased the need to replenish them, placing companies like Lockheed Martin in a strong position to benefit from sustained defence spending.
Removed – Hermès International SCA (RMS). Hermès is a French luxury house founded in Paris in 1837, best known for its leather goods, especially the Birkin and Kelly handbags, along with silk scarves, ready-to-wear and fragrances. The group has long stood out for its pricing power, deliberate scarcity and industry-leading margins. However, the broader luxury market has entered a downturn as consumers come under pressure from the energy shock and persistently high inflation, which are squeezing discretionary spending. Even best-in-class names are not immune to a slowdown in demand, and with the shares still trading at a premium valuation, we felt the risk-reward no longer justified the position and chose to exit.
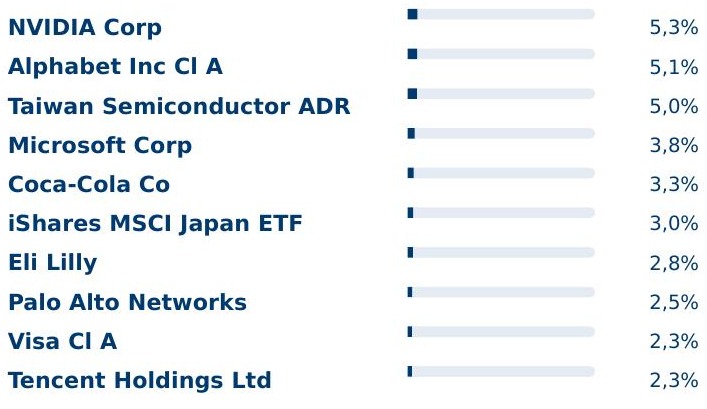
Top 10 Holdings
Annualised returns (%)

Portfolio strategy
In the wake of heightened market volatility, our stance has been to remain disciplined and avoid reactive portfolio shifts. History consistently shows that impulsive responses to short-term political noise often result in suboptimal investment outcomes.
Instead, we have used this environment to evaluate high-quality businesses that were indiscriminately sold off despite their strong long-term fundamentals. Periods of uncertainty can create attractive entry points into quality companies at compelling valuations, and we continue to focus on identifying these opportunities with a long-term perspective.
The portfolio remains invested in leading global businesses with durable competitive advantages, particularly those delivering high returns on capital and robust free cash flow generation. Dividend policies are not a central consideration in our selection process, as we generally favor companies that reinvest earnings to drive future growth.
We also resist the temptation to follow short-lived market trends or fashionable investment narratives, as preserving portfolio quality takes precedence over chasing momentum.
Top Pick Of The Month: Kraneshares Humanoid Robotics ETF (KOID)
Physical AI | Full Value Chain | TER 0.69%

Investment Case
Robots entered factories in the 1960s as fixed, single-task arms, and makers such as Fanuc still anchor automated production lines. AI now gives robots a “brain”, while humanoid “bodies” can work in spaces built for people. The industry is moving from prototypes to commercial production, with 2025–2026 the first years of adoption: the humanoid called Figure 03 assembles cars at BMW, UBTech’s Walker S2 works in Audi, BYD and Geely plants, and Agility’s Digit leads warehouse hours through Amazon.
BofA forecasts shipments rising from 20,000 units in 2025 to 10 million by 2035, and Morgan Stanley projects 1 billion humanoids and $5 trillion in annual revenue by 2050. KOID, the first US-listed humanoid robotics ETF, tracks the MerQube Global Humanoid Robotics and Physical AI Index to give investors the whole ecosystem in one liquid vehicle.
Economic Moat
KOID owns the suppliers every platform relies on rather than betting on one winner: actuation and mechanical systems make up about 55% of a humanoid’s cost, sensing 15% and intelligence 23%.
Business Strategy Outlook
- Physical AI: Models such as NVIDIA’s Isaac GR00T N1 let robots learn tasks from 5–10 demonstrations, down from thousands.
- Labour demand: A global manufacturing shortfall of nearly 8 million workers is expected by 2030; over 28% of Japan’s population is over 65.
- Falling costs: BofA sees unit costs falling from $35,000 in 2025 to $13,000–$17,000 by 2030–2035.
- Critical components: Each robot uses 120–200 bearings, benefiting suppliers such as Leader Drive, Sanhua, Tuopu and MP Materials.
Capital Allocation
The index screens 3,000+ companies for at least $1bn market cap and $1m daily traded value, narrows them to 800+ humanoid and Physical AI names, and scores each on its direct humanoid involvement. Holdings are equal-weighted and rebalanced quarterly. At end-June the “body” made up 69%, the “brain” 25% and integrators 6%; by country, the US is 39.4%, China 24.3% and Japan 11.4%. Unitree’s August 2026 STAR Market listing could add a leading integrator.
Financial Strength
Since its June 2025 launch KOID has returned 46.75% (36.21% a year) to 31 August 2026, including 23.07% over one year and 14.70% year to date, closely tracking its index (23.09% and 14.74%). Returns swing sharply: +33.49% in the three months to June, then −12.87% to August. Net assets grew from $272.2m at end-June to $333.7m, and the net expense ratio is 0.69% (0.79% gross) with a fee waiver until August 2028.
Key Risks
- Volatility and concentration: A narrow, non-diversified fund that fell 12.87% in the three months to August; its holdings tend to move together.
- China and A-share exposure: About 24% is in China, with trading halts, repatriation limits and US-China trade tension risks.
- Early-stage profits and valuation: Many holdings are not yet profitable, and some component makers are priced on future volumes rather than current earnings.
- Fund size and liquidity: A small shareholder base means large redemptions could force sales at poor prices, and bid-ask spreads can widen.
- Foreign and currency risk: About 60% is invested outside the US, exposing returns to currency swings and weaker disclosure standards.
Source: KraneShares. Data as at 31.08.2026 unless stated. Past performance does not guarantee future results.
Same as Ever – Chapter 14: Casualties of Perfection
Morgan Housel opens Chapter 14 with a lesson from biology: perfection in one trait is paid for in another. Evolution has spent 3.8 billion years testing this idea. The best-adapted species excel at some things and die because of what they are not good at. A century ago, the Russian biologist Ivan Schmalhausen described how it works: a bigger lion catches more prey but makes a larger target for hunters, and a taller tree captures more sunlight but is more exposed to wind damage. Most animals and plants end up ordinary in size, because pushing any one trait to its limit backfires.
The same logic applies to how we spend our time. Many people chase an efficient life in which no hour is wasted. Psychologist Amos Tversky saw it differently: “the secret to doing good research is always to be a little underemployed. You waste years by not being able to waste hours.” Time to wander, think and do nothing in particular is not slack to be squeezed out. It is where much useful thinking happens.
The conventional workday assumes thinking can be scheduled like production, and it cannot. Work that depends on judgement and creativity, such as research, strategy and investing, tends to improve when people have unstructured time to step back, and to suffer when every hour is filled.
The cost of over-optimising
Evolution is the model to copy. It is untidy, full of trade-offs and spare parts, yet it has survived 3.8 billion years of testing. A perfectly optimised organism is built for one environment, and when that environment changes it has nothing left to fall back on. Since risk is what we do not see, the slack that looks wasteful in calm periods is what pays for the surprises nobody predicted.
Businesses fall into the same trap. Systems tuned for maximum efficiency carry no spare capacity, so they run well until something unexpected happens and then fail badly. The COVID-19 pandemic exposed this in lean supply chains with no room for error. Because risk is what we do not see, redundancy looks like waste right up until the moment it proves essential. The same is true of a calendar with no gaps: it leaves no capacity for the emergency, the opportunity or the unplanned idea.
Finance offers the clearest examples of why a little inefficiency is the ideal place to be. Cash is a drag on returns in a bull market, but as valuable as oxygen in a bear market, either because you need it to survive a downturn or because it is the raw material of opportunity.
Leverage is the most efficient way to maximise a balance sheet and the easiest way to lose everything. Concentration is the best way to maximise returns, while diversification is the best way to raise the odds of owning a company capable of delivering them.
What this means for investors
There is an old investing adage that it is better to be approximately right than precisely wrong. Yet much of the industry’s effort goes into decimal-point forecasts that lead people to believe they hold the best possible portfolio. A forecast that is good enough leaves more time and attention for the behaviours that last: staying invested, holding reserves and spreading risk.
For private clients, the practical lesson is to build in slack on purpose. Hold cash reserves that a spreadsheet would call idle, avoid borrowing that leaves no margin for error, and diversify even when a concentrated bet looks cleverer. Each costs a little return in good years and is what keeps a plan intact in bad ones. Like the lion and the tree, a portfolio built to maximise one thing is exposed on everything else. The aim is a portfolio that is durable, not perfect.
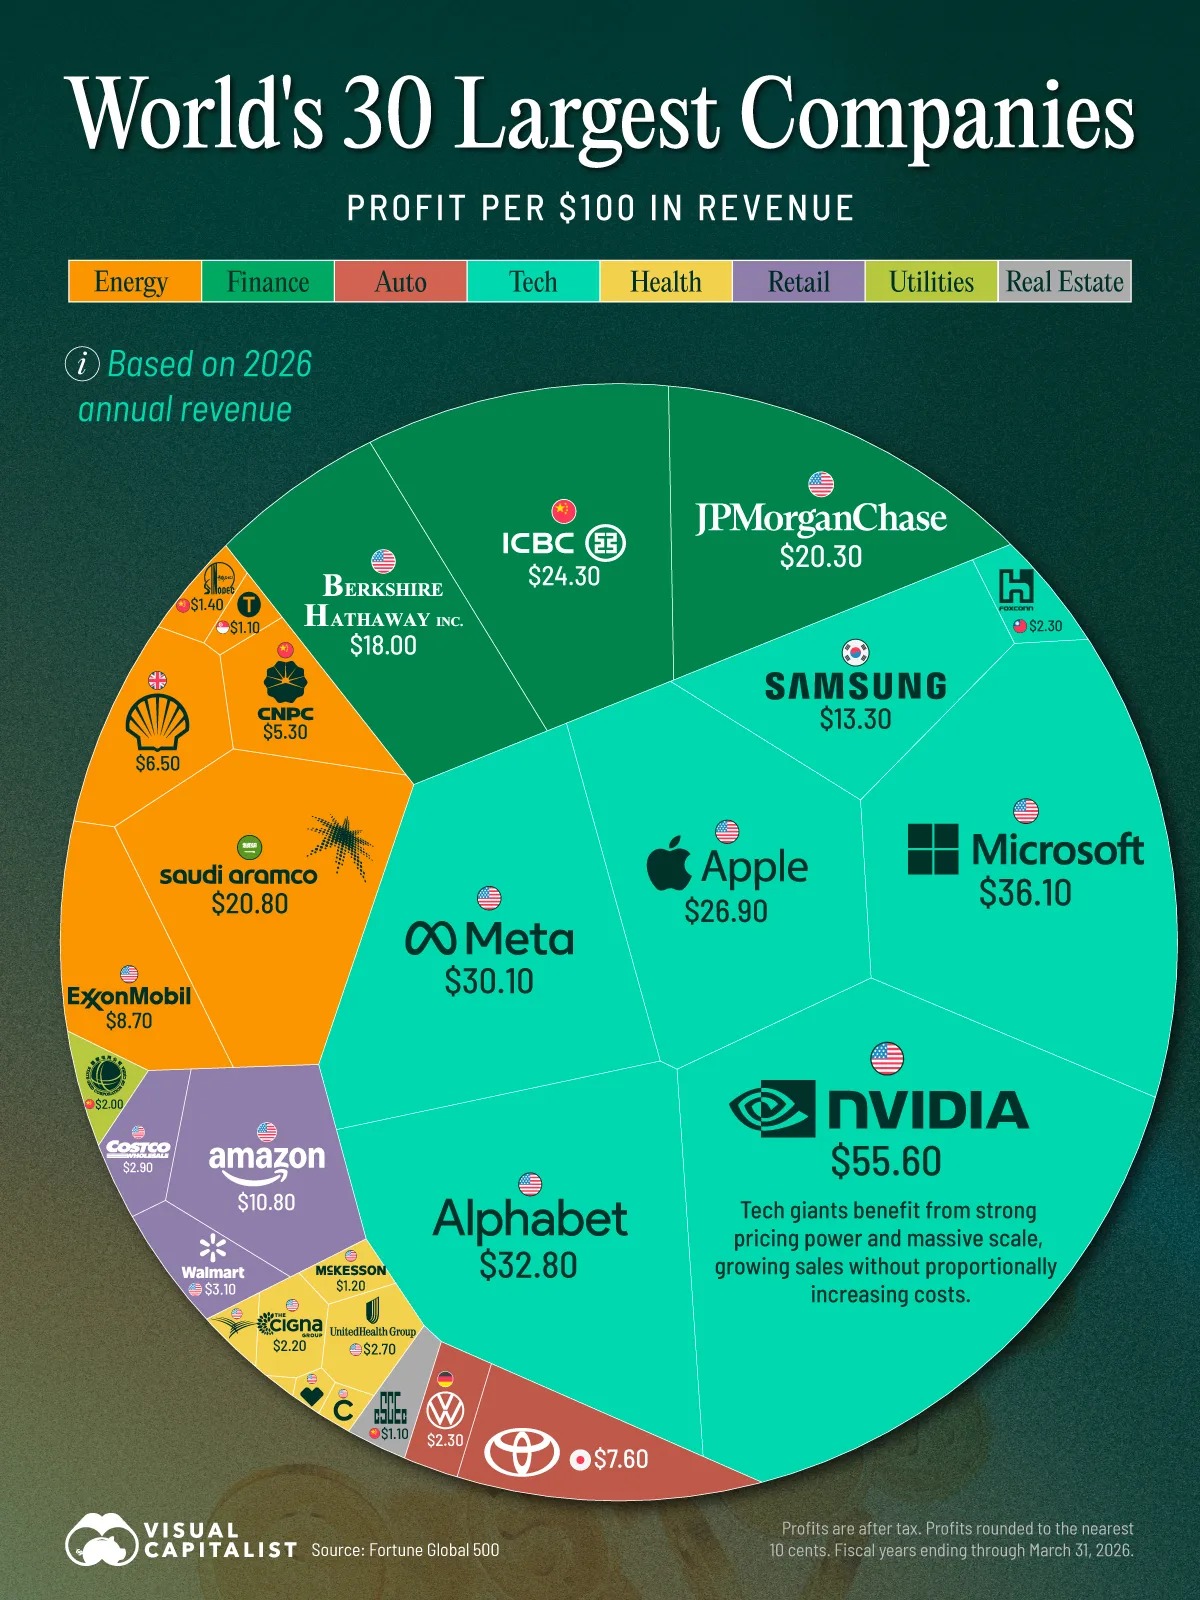
Graph of the month – World’s 30 Largest Companies by Profit
Source: Visual Capitalist
Sources
Sources: Alpine Macro, Anchor, Barchart, Bloomberg, BNY Mellon, Business Day, BusinessTech, Central Energy Fund, Charlie Bilello, Citi, CNBC, Compound Advisors, DigitFMS, Edmond De Rothschild, ETFMG, EWN, FactSet, Finimize, FXStreet, Haver Analytics, Investing.com, InvestorIdeas, IOL, JP Morgan, Julius Baer, LSEG, Moneyweb, Morgan Stanley, Morningstar, News24, Refinitiv, Reuters, RMB, SAnews, SARB, Société Générale, Statista, Statistics South Africa, Strategas, Sygnia, The Intelligent Investor, The South African, TimesLIVE, Trading Economics, TreasuryONE, UBS, Vutivi Business, Wise.
Disclaimer
VEGA Asset Management has taken care that all information provided in this document is true and correct. VEGA Asset Management does not accept responsibility for any claim, liability, loss, expense, or damage. Any information herein is not intended nor does it constitute financial, tax, legal, investment, or other advice. VEGA Asset Management is an authorised Financial Service Provider with FSP number 776. Past performance is not necessarily an indication of future performance.